Download
1 / 13
430 likes | 1.98k Views
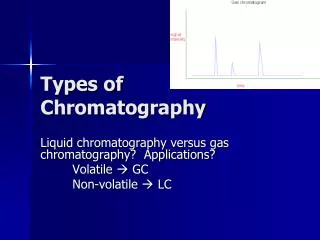
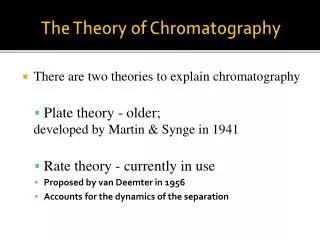
The Theory of Chromatography. There are two theories to explain chromatography Plate theory - older; developed by Martin & Synge in 1941 Rate theory - currently in use Proposed by van Deemter in 1956 Accounts for the dynamics of the separation. Column. Theoretical plate.

E N D
The Theory of Chromatography • There are two theories to explain chromatography • Plate theory - older; developed by Martin & Synge in 1941 • Rate theory - currently in use • Proposed by van Deemter in 1956 • Accounts for the dynamics of the separation
Column Theoretical plate Plate Theory - Martin & Synge 1954 Nobel Laureates • View column as divided into a number (N) of adjacent imaginary segments called theoretical plates • Within each theoretical plate analyte(s) completely equilibrate between stationary phase and mobile phase
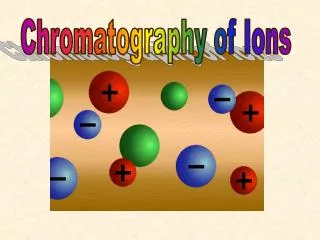
Mobile phase Sample mixture Equilibrium establishes at each point (ideally) Stationary phase Chromatographic principle The molecules of the mixture interact with the molecules of the Mobile and Stationary Phase Retardation of rate of movement of molecules Each molecule interacts differently with MP and SP Different distribution coefficients and different net rates of migration
Significance? • Greater separation occurs with: –greater number of theoretical plates (N) –as plate height (H or HETP) becomes smaller L = N H or H = L / N where L is length of column, N is number of plates, and H is height of plates or height equivalent to theoretical plate (HETP)
N can be Estimated Experimentally from a Chromatogram • The number of theoretical plates that a real column possesses can be found by examining a chromatographic peak after elution by various methods like • half-height method • USP method
N can be Estimated Experimentally from a Chromatogram •N = 5.55 tR2/ w1/22 = 16 tR2/ w2 where: tR is retention timew1/2 is width at h0.5w is width measured at baseline N is a ratio of tR and σ of Wb which is 4σ
Where: N = Number of theoretical plates Ve = elution volume or retention time (mL, sec, or cm) h = peak height w1/2 = width of the peak at half peak height (mL, sec, or cm)
Choice of Column Dimensions: maximum efficiency • Nmax = 0.4 * L/dp where:Nmax - maximum column efficiencyL - column lengthdp - particle size • So, the smaller the particle size the higher the efficiency!
First Important Prediction of Plate Theory Band spreading - the width of bandsincreases as their retention time (tR) or retention volume (VR) increases
Problem: A band exhibiting a width of 4 mL and a retention volume of 49 mL, is eluted from a column. What width is expected for a band with a retention volume of 127 mL eluting from the same analyte mixture on the same column? ANS: 10.4 mL
Second significant prediction of plate theory The smaller HETP, the narrower the eluted peak
Plate Theory – Practical Considerations • It is not unusual for a chromatography column to have millions of theoretical plates • Columns often behave as if they have different numbers of plates for different solutes present in same mixture