Download

1 / 22
230 likes | 466 Views
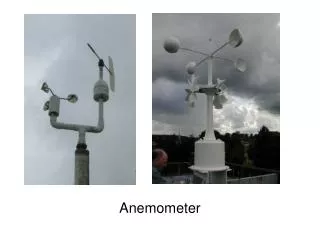
Design of a 1-D Sonic Anemometer MDR Presentation. Group Members : Vanessa Dub é , Michael Jao, Chethan Srinivasa, Robert Vice Advisors : Professor Jackson (ECE Department), Professor Voss (Geoscience Department). Background. What is a Sonic Anemometer? Device that measures wind speed

E N D
Design of a 1-D Sonic AnemometerMDR Presentation Group Members: Vanessa Dubé , Michael Jao, Chethan Srinivasa, Robert Vice Advisors: Professor Jackson (ECE Department), Professor Voss (Geoscience Department)
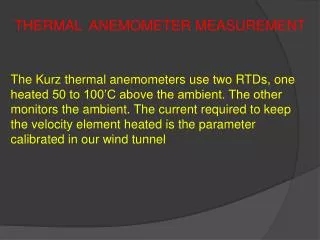
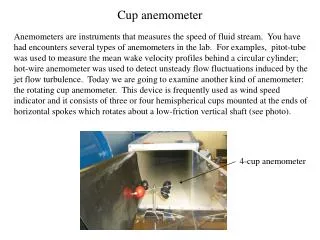
Background • What is a Sonic Anemometer? • Device that measures wind speed • What is unique about our anemometer? • Will measure small wind speeds • Will be utilized by the Geoscience Department for weather research
Background (Cont’d) • Anemometer uses transducers to send and receive ultrasonic signals through air • Used two transmitters and two receivers • Absolute time will vary with wind speed • Sine wave sent from function generator to both transmitters
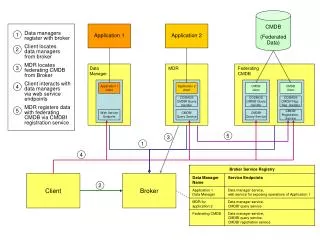
Block Diagram Speaker 1 Receiver 1 Receiver 2 Speaker 2 Frequency Generator Comparator Circuitry LED Display PLD
Initial Calculations • Found how absolute time was affected by a change of 1mm/s in velocity • Began with simple equations for velocity that relate distance, time, and temperature to speed of signal • Assumed room temperature, so that the velocity of sound in air was 343.37 m/s • Looked at the change in absolute time that resulted from a change of 1mm/s in wind speed over a distance of 1.06 m
Initial Calculations (Cont’d) • Calculated t1 and t2 • Found change in absolute time • Found the frequency of the counter we will need • Chose a counter frequency higher than 58.95MHz • Solved for the number of bits in the counter register
Zero Crossing Detector • Chose to convert sine waves to digital signals using LM339 Comparator • Digital signal is high only when amplitude of the sine wave is greater than zero • Distance between zero crossings stays the same width • Must use zero crossings because of amplitude variations caused by side winds • Phase difference of two received waves is the difference in zero crossing locations
Comparator • Used LM339 because operates at higher frequencies and has less delay time • Comparator circuitry:
Comparator (Cont’d) • Input and output waveforms of comparator circuitry
Comparator Theory This shows that we only need to find the change in time between the two waves. For Example:
Transducers • Part numbers P9895-ND and P9894-ND • One for transmit and one for receive • Lowest frequency for cost effectiveness and • familiarization • Nominal frequency 40.0 kHz • Temperature range -40-100°C Sensitivity is 0dB
Transducers (Cont’d) • Optimal measured frequency of 40.2 kHz • Continuous sine input for optimal received • signal
DC fan 4”x84” PVC drain pipe Quick-cap (end cap) 6’x2”x2” pine board with slots separated 5” CD case for mounts Wendy’s™ straws Twisted pair insulated wire Test Setup
Wind Flow Testing • Developed method to test wind speed generated by fan
Wind Flow Testing (Cont’d) • Read phase difference from oscilloscope • Compared generated wind speed to wind speed observed by system • Found observed wind speed to be relatively close to actual wind speed
PLD/Counter • PLD Counter (Right) • - Temporary until counter is received • 4 MHz clock (will use 125MHz ) • PLD Controller (Left) • - For direction and clock signal
Complications • BiCMOS Comparator has offset base current, which affects the zero-crossing detection • An LM741 is not capable of functioning properly with a 40kHz signal, which forced us to use the LM339 comparator • Side winds affect the amplitude of the wave, which greatly affects the zero-crossing detection • Noise in the system had to be minimized
Conclusion • We were able to remedy several of the complications • Anemometer is capable of measuring a wind speed, and was tested on the oscilloscope • Although there is an initial offset, shown by the graphs, the proper trend is followed • From here, we will be able to use digital logic and display the wind speed on 15 LED’s, as well as display the direction