Utility Scale Arc Flash Analysis using CAPE System Simulator
This project aims to develop a macro in the CAPE System Simulator for efficient arc flash analysis in utility transmission systems. With strict compliance to IEEE 1584 and updated NESC 2012 codes, the study focuses on reducing arc flash levels below Category 2 to enhance worker safety. Key elements include data gathering, model development, running the arc flash macro, and evaluating results for specific substations. The project team comprises experienced protection engineers, ensuring a comprehensive compliance solution for both medium and high voltage networks.
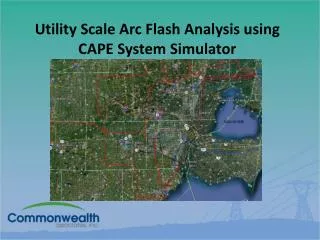

Utility Scale Arc Flash Analysis using CAPE System Simulator
E N D
Presentation Transcript
Utility Scale Arc Flash Analysis using CAPE System Simulator
BIOGRAPHY • Commonwealth Associates, Inc. • Project Manager: Ian Hutt, P.E. • Main office Jackson, MI; remote offices in GA, WA, NM, OH, and VA. • Over 200 employees. • Electrical studies, transmission planning and protection, substation design, transmission line design, permitting, and right-of-way acquisition.
What is driving new utility arc flash requirements? • IEEE 1584 requires employers to review low voltages, 50-1000 V. NESC 2012 code defers to IEEE 1584, and requires study specifically for 1000 to 800 kV. • New NESC 2012 requirements now overrule previous exception from NESC 2007 for utilities. • NESC code requires utilities to have compliance by Jan 1, 2009. • Many utilities are looking for a comprehensive solution that includes medium and high voltage networks • References include Table 410-1 and 410-2 in Part 4: Rules for the Operation of Electric Lines in the NESC code
PROJECT BACKGROUND • Objective: create a macro in CAPE to allow for easy calculation of arc flash at specified busses in a utility transmission system • Project: Study a few select substations, and develop an engineering report. • The method used for the select substations could then be applied to remaining system busses by utility internal staff. • Arc flash labels and operating procedures could be developed based on study results. • Utility wanted to reduce or eliminate arc flash levels to below Category 2, to reduce or eliminate the need for more bulky PPE for workers in the field.
THE PROJECT TEAM Ian Hutt, P.E. Project Manager / Lead Engineer Claire Patti, P.E. Protection Engineer Chris Nelson, E.I.T. Protection Engineer Jeanette Dodge Engineering Aide A special thank you to Ashok Gopalakrishnan, Daryl Coleman, and Paul McGuire at Electrocon International.
PROJECT FLOW CHART • DATA GATHERING • Receive CAPE Model • Receive Protection Drawings • MODEL DEVELOPMENT • Develop model to be fully functional in system simulator • Validation • ARC FLASH MACRO • Run Arc Flash Macro • Compile results • EVALUATION • Evaluate Results • Report • Develop Labels
INFORMATION REQUIRED FROM UTILITY • System short circuit model • Protection drawings (Used to develop and validate model) • Relay setting sheets • Are relay setting sheets and drawings electronic? • Review with utility protection engineers (to ensure model accuracy)
CAPE ONE LINE Develop CAPE one-line and compare to existing system diagrams • Simple vs. detailed bus structures • Transfer tripping • Layout • Formatting
PROTECTION Evaluate Relays in Model • Are settings up to date and accurate? • Are all necessary relays included? • Bus vs. line vs. backup protection • Electromechanical vs. digital relays What tools are available to bring over relay settings into CAPE?
CONTACT LOGIC • System Simulator requires the use of contact logic to simulate the tripping outputs of a relay. • Contact logic code/expression rules and guidelines. • Use of a standard format for contact logic expression to allow for repeatability • Include use of timers for certain protection schemes.
VALIDATION OF SYSTEM SIMULATOR • Run simple test analysis to verify System Simulator operation. • Test by placing faults to be picked up by protection and verify operation. • Disable primary protection to verify timing and operation of backup protection. • Can be automated for large scale checking of network
DEVELOPMENT OF MACRO • Macro was developed by protection engineers experienced in arc flash calculation • Macro was based on existing arc flash macro developed by Ashok Gopalakrishnan at Electrocon • Macro was developed to provide output based on total accumulated incident energy for a specified fault occurrence • Macro designed to be used on a large, utility-scale network to study bus faults • Macro can be easily adapted to special cases, based on utility preference
RUNNING ARC FLASH MACRO • Macro can be run from CAPE System Simulator module. • First, input macro using CAPE File | Input • Second, type macro command from command bar
RUNNING ARC FLASH MACRO (continued) • Once macro is called, a window will pop up with choices for the user. • Can select one bus to study, or a set of busses. The set “Allbuses” will study entire network.
RUNNING ARC FLASH MACRO (continued) • Choose a fault type; 3PH, SLG, 2PH, LL are available (only SLG used for above 15 kV) • Specify working distance (18” through 48” available; macro can be adjusted to accommodate special cases)
RUNNING ARC FLASH MACRO (continued) • Choose a bus gap (distance between busses; macro recommends gap based on voltage) • Specify if faults will be open or closed box (only applies for low voltage faults)
RUNNING ARC FLASH MACRO (continued) • You can specify the filename path, or allow the default • Select time units in seconds or cycles • Macro allows for fault resistance to reduce fault current to 85% of full, per IEEE 1584 recommendations
RUNNING ARC FLASH MACRO (continued) • Selecting detailed reporting allows easy understanding of results, with a definition of each value. Selecting “No” allows for easy input into a database or spreadsheet.
RUNNING ARC FLASH MACRO (continued) • Using the Category filter, you can get results for only those areas that exceed a certain Category threshold. • By doing this, you can study large systems and only see the areas where arc flash hazard is above a certain level.
RUNNING ARC FLASH MACRO (continued) • Macro runs in System Simulator; checks coordination for fault • Macro runs in a loop to clear all faults for each protective element step (up to 30), recording accumulated incident energy level
RUNNING ARC FLASH MACRO (continued) • Based on the run, the detailed report shows the study results. • For this case, using the macro on the CAPE.GDB database, bus 150 has a Category 3 rating.
RUNNING ARC FLASH MACRO (continued) • The results show the: • Total fault current • Total clearing time • Total incident energy • Flash protection boundary • The detailed report shows the step-by-step results; selecting “No” to detailed reporting will show only totals.
Real Data • Commonwealth Arc Flash macro was run on a real utility system that has a complete System Simulator capable model. • Bus names have been removed for confidentiality. • Example shows how macro can be applied to a real model, and used to calculate arc flash hazard for a system model. • Model used was a transmission voltage network, and has simple buses representing substations.
Real Data Summary • The results table can be reviewed and results addressed by severity. Areas with high incident energy levels can be mitigated to reduce arc flash hazard. • A full review is required at each location to ensure the results are accurate and reasonable. • Below is the summary of results by total: • Category 4+ 5 • Category 4 1 • Category 3 9 • Category 2 3 • Category 1 6 • Category 0 24
REPORTING AND LABELS • Results in an Excel spreadsheet or database program to review data. • Data can be presented in the form of an Arc Flash Report deliverable. • Arc Flash Report can be used as a guide for developing safe work practices and procedures. • Arc Flash Report can be a guide for selecting appropriate personal protective equipment (PPE). • Safety labels created based on the data to ensure worker safety and adequate warning for hazards.
WE ARE HAPPY TO PROVIDE MORE DETAILED INFORMATION REGARDING METHODS USED IN THIS PROJECT. Send questions to Ian Hutt Ian.Hutt@cai-engr.com
QUESTIONS FOR YOU… • Does your utility have an arc flash study in place? • For your high voltage network? • For your distribution voltage network? • For low voltage devices on your network? • Does your CAPE model have System Simulator capability? • Does System Simulator capability have value? • What are the expected costs associated with arc flash study? • What are the expected costs associated with model development for System Simulator capability?