Download
1 / 21
250 likes | 455 Views
Utility Scale Rooftop Solar. Ability of neighborhood solar to defer new electrical facilities . Purpose of presentation . Describe Rocky Mountain Power’s in-depth study of neighborhood solar to offset the need to build new infrastructure (power plants, substations and lines)

E N D
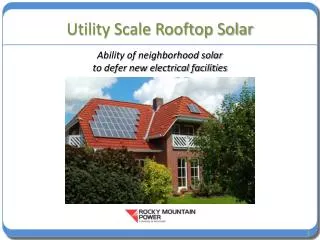
Utility Scale Rooftop Solar Ability of neighborhood solar to defer new electrical facilities
Purpose of presentation • Describe Rocky Mountain Power’s in-depth study of neighborhood solar to offset the need to build new infrastructure (power plants, substations and lines) • Outline Rocky Mountain Power’s progress on Utah carbon reduction goal • Describe Rocky Mountain Power’s support of customer-owned renewable energy
Customer use on the rise • Rocky Mountain Power residential customers use about 26% more electricity than 20 years ago • To meet our obligation to serve, additional power supply resources, substations and power lines are needed to meet growing customer use • New facilities are expensive and difficult to permit • Advocates want different solutions
Can rooftop solar defer new facilities? • Customers questioned substation expansion in an established neighborhood • Public opposition delayed conditional use permit • Undertook subsequent study of rooftop solar to determine its ability to meet customer use SOUTH TEMPLE UNIVERSITY STREET 1100 EAST 900 EAST 400 SOUTH Study Area Boundary
Scope of the solar opportunity 80 ft. 60 ft. 40 ft. 20 ft.
Determining panel location 6:30pm 12:30pm 9:30am • Evaluated roof shading on every structure • Determined solar exposure • Locate solar panels where they produce the most energy 176 Panels 97.79kWh/day 19.8% usable roof
Study aims to maximize solar output • Two-thirds of rooftops are suitable for solar panels (237 of 356 ) • Total number of panels 13,304 • Study uses high efficiency panels; solar energy to electricity = 19%
Here comes the sun Customer Use Solar Production
Here comes the sun Customer Use Solar Production
Here comes the sun Customer Use Solar Production
Here comes the sun Customer Use Solar Production
Here comes the sun Customer Use Solar Production
Here comes the sun Customer Use Solar Production
Here comes the sun Customer Use Solar Production
Here comes the sun Customer Use Solar Production
Here comes the sun Customer Use Solar Production
Here comes the sun Customer Use Solar Production
Here comes the sun Customer Use Solar Production
Here comes the sun Customer Use Solar Production
Estimated solar production • Solar Energy Conversion: • 2,210 MWh annual energy production • 1,560 MWh during summer months (May-Sept.) • Maximum Solar Power Output – as calculated • June 21 = 1.52 MW (summer solstice) • Temperature Corrected = 1.45 MW at 76o F • Solar Output on Circuit Peak • August 2 = 0.54 MW (2010 circuit peak) • Temperature Corrected = 0.48 MW at 93o F • Projected 2011 Circuit Peak = 4.6 MVA
Solar contribution to peak Actual customer load Circuit Peak Solar output at ideal conditions