Download
1 / 3
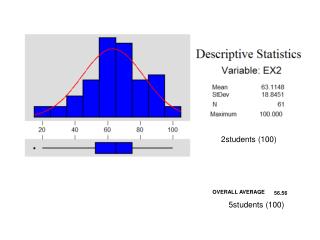
Effect of Peer Group Size on Student Performance: A Scatter Plot Analysis
30 likes | 98 Views
This study examines the relationship between peer group size and student performance, using data from 100 students. By conducting a scatter plot analysis, the overall average of 56.56 among 2 students and 56.5 among 5 students is compared. The results shed light on how group size influences academic outcomes and can provide insights for educators and policymakers.
Download Presentation 
Effect of Peer Group Size on Student Performance: A Scatter Plot Analysis
An Image/Link below is provided (as is) to download presentation
Download Policy: Content on the Website is provided to you AS IS for your information and personal use and may not be sold / licensed / shared on other websites without getting consent from its author.
Content is provided to you AS IS for your information and personal use only.
Download presentation by click this link.
While downloading, if for some reason you are not able to download a presentation, the publisher may have deleted the file from their server.
During download, if you can't get a presentation, the file might be deleted by the publisher.
E N D


More Related