Analyzing the Relationship Between Gender and Election Participation in a City
This study examines the relationship between gender and voter participation in the last election among one million eligible voters in a city, using a random sample of 10,000. The results indicate that more women voted than men, suggesting a potential relationship between gender and voting behavior. The analysis includes computing marginal totals, expected counts, chi-square statistic, degrees of freedom, and P-value, and ultimately draws conclusions about the relationship between gender and election participation.

Analyzing the Relationship Between Gender and Election Participation in a City
E N D
Presentation Transcript
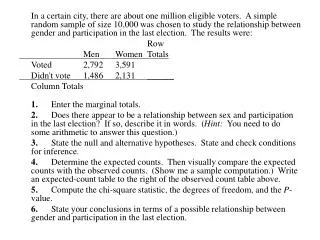
In a certain city, there are about one million eligible voters. A simple random sample of size 10,000 was chosen to study the relationship between gender and participation in the last election. The results were: Row Men Women Totals Voted 2,792 3,591 Didn't vote 1,486 2,131 ______ Column Totals 1. Enter the marginal totals. 2. Does there appear to be a relationship between sex and participation in the last election? If so, describe it in words. (Hint: You need to do some arithmetic to answer this question.) 3. State the null and alternative hypotheses. State and check conditions for inference. 4. Determine the expected counts. Then visually compare the expected counts with the observed counts. (Show me a sample computation.) Write an expected-count table to the right of the observed count table above. 5. Compute the chi-square statistic, the degrees of freedom, and the P-value. 6. State your conclusions in terms of a possible relationship between gender and participation in the last election.
Reading Response Solutions #3) On next slide (assumptions)
For the Minitab output below, answer the following questions: • What is a and b? What parameters do these numbers estimate? • What is SEb? • What is r? • What number estimates the standard deviation of the response?
Example 15.1 Infants who cry easily may be more easily stimulated than others. This may be a sign of higher IQ. Child development researchers explored the relationship between the crying of infants 4-10 days old and their later IQ test scores. A snap of a rubber band (ouch!) on the sole of the foot caused the infants to cry. The researchers recorded the crying and measured its intensity by the number of peaks in the most active 20 seconds. They then went home to their dogs.
Later on , the researchers, still childless, measured the children’s IQ at age three years using the Stanford-Binet IQ test. The following table contains data on the 38 infants, who were scarred for life. Perform a significance test to see if crying has a straight line relationship with IQ and a 95% CI.Cry IQ Cry IQ Cry IQ
There is some evidence that drinking moderate amounts of wine helps prevent heart attacks. The table gives data on yearly wine consumption (liters of alcohol from drinking wine, per person) and yearly deaths from heart disease (deaths per 100,000 people) in a dozen developed nations. Alc. Heart Alc. Heart from disease from disease Country wine deathsCountry wine deaths Austria 3.9 167 Spain 6.5 86 Canada 2.4 191 Sweden 1.6 207 Denmark 2.9 220 Switz. 5.8 115 France 9.1 71 UK 1.3 285 Ireland 0.7 300 USA 1.2 199 Italy 7.9 107Germany 2.7 172 1. Make a scatterplot that shows how wine consumption affects heart disease. Label the vertical axis from 50 to 300 with increments of 25; use your calculator to obtain the LSRL equation and correlation. 2. Formulate null and alternative hypotheses about the slope of the true regression line. Report the sum of the 12 residuals and the sum of the squares of the residuals. What is the value of s (the standard error about the line)? 3. The model for regression inference has 3 parameters: a, b, and s. Estimate these parameters from the data. 4. Check the assumptions. 5. What is your test statistic and conclusion? 6. Computer output reports that the standard error of the slope is SEb = 3.511. Use this to construct a 95% confidence interval for the slope b of the true regression line.