Download
1 / 24
280 likes | 629 Views
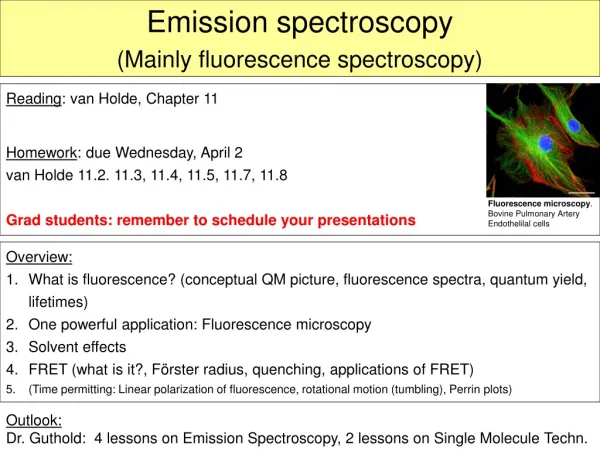
HORIBA Jobin Yvon Fluorescence Division Presents: Time-Resolved Fluorescence Spectroscopy Edison, NJ March 15, 2005. Fluorescence: a type of light emission. First observed from quinine by Sir J. F. W. Herschel in 1845. Yellow glass of wine Em filter > 400 nm.

E N D
HORIBA Jobin Yvon Fluorescence Division Presents:Time-Resolved Fluorescence SpectroscopyEdison, NJMarch 15, 2005
Fluorescence: a type of light emission • First observed from quinine by Sir J. F. W. Herschel in 1845 Yellow glass of wine Em filter > 400 nm 1853 G.G. Stoke coined term “fluorescence” Blue glass Filter Church Window! <400nm Quinine Solution
Common Fluorophores Typically, Aromatic molecules • Quinine, ex 350/em 450 • Fluorescein, ex 485/520 • Rhodamine B, ex 550/570 • POPOP, ex 360/em 420 • Coumarin, ex 350/em 450 • Acridine Orange, ex 330/em 500
Blue Excitation Absorption femtoseconds S2 excited state Internal Conversion Absorbance energy S1 excited state Fluorescence nanoseconds Nonradiative dissipation Ground State Electrons
Basic Principles of Fluorescence • Emission at longer wavelength than excitation (Stoke shift) • Emission spectrum does not vary with excitation wavelength • Excitation spectrum same as abs spectrum • Emission spectrum is a mirror image of its excitation/abs spectrum
“Stokes” shiftAbsorption vs Emission E = hc /
Time Resolved Fluorescence • What’s happening during the time of the fluorescence emission • Fluorescence Lifetime
1 0.8 0.6 t=1/e=37% I(t) 0.4 0.2 0 0 500 1000 time, ps What is a Fluorescence Lifetime? Random Decay Back to Ground State: Each Molecule Emits 1 Photon Population of Molecules Excited With Instantaneous Flash
Why Measure Lifetimes? • Absolute measurement - lifetime normally independent of sample concentration • Lifetime can be used as probe of local environment (e.g. polarity, pH, temperature etc) • Additional dimension to fluorescence data map - increases measurement specificity • Dynamic vs static – e.g. measure rotational correlation times and energy transfer using lifetime data
Time Domain TCSPC Time Correlated Single Photon Counting
TBX-04 Cumulative histogram statistical single photon events nanoled S periodic pulses CFD SYNC • ≤ 2% TAC rate 1MHz Coaxial Delay 50 Ns Sync delay 20 ns MCA V TAC IBH 5000U TCSPC Instrument Principle
Time Domain Convolution Principle d-pulse decay Intensity as function of time: I(t)=a exp (-t/t) d 0 convolved decay d-1 Lamp intensity as function of time: L(t) d-2 d-3 Fluorescence Convolution: F(t)= I(t) L(t) d-4
Example: HSA protein decay • Nanosecond flashlamp excitation at 295nm • Emission detected at 340nm • Three lifetimes detected: 0.8ns, 3.6ns and 7.2ns.
HOT ns FLASHes! JY-IBH Ltd. Announces the Launch of: 280 nm NanoLED Facilitates ps work with tryptophan! Huge savings over Ar and TiS lasers! 340 nm NanoLED Replaces expensive Nitrogen lasers!
NanoLED Pulsed laser diode and LED excitation sources • (dashed) Laser Diodes emit ~100ps pulses • (solid) LEDs emit ns pulses
NanoLED SourcesPulse Widths • Laser Diodes • ~ 50ps – 150ps optical pulse FWHM • Diode dependant: Typically red (635nm/650nm) diodes are faster than violet, UV, blue, cyan • N-07N high intensity 405nm source ~ 750ps • LEDs • New 280nm & 340nm 1ns • All other LEDs ~ 1.0 – 1.4ns diode dependant
TBX Features • Compact and integrated picosecond photon detection module • Fast rise-time PMT with integral GHz timing preamplifier, constant fraction discriminator and regulated HV supply • Factory optimised • Timing performance typically ~ 180ps (< 250ps guaranteed) • Much cheaper and more robust than an MCP • Photocathode sensitivity comparable to MCP • 9.5mm active area => easier to use than SPADs • Easy to use “plug-and-play” operation:15V + Photons in Logic pulses out • NIM & TTL output signal • Timing performance good enough for most applications (MCP upgrade available) • Gold plated housing for maximum noise immunity
TBX Integrated Module Power requirements 15V: TBX modules can be powered either from the back of the DataStation HUB (un-cooled TBX-04 model only) or by the TBX-PS
TBX Models All TBX models can be used on any JY-IBH system or sold as a component to upgrade systems from other manufacturers • TBX-04 • Spectral response 185nm-650nm • Dark counts < 20cps typical, 80cps maximum • TBX-05 • Spectral response 300nm-850nm • Thermoelectrically cooled photocathode • Dark counts < 20cps typical • Recommend TBX-PS to power cooler • TBX-06 • Spectral response 185nm-850nm • Thermoelectrically cooled photocathode • Dark counts < 20cps typical • Recommend TBX-PS to power cooler
Advantages of TCSPC • Single-photon sensitivity works well with weak samples;<1nM routine with laser excitation • Wide temporal range (10ps to seconds) depending on excitation source and detector combination • Intuitive data interpretation, uses Poisson statistics • Rapid data acquisition with diode excitation sources (especially complex decays)