Normal Distributions & Confidence Intervals
Learn about the Central Limit Theorem, Standard Normal distribution, calculating probabilities using Integrating.xls, confidence intervals for Z, and interpreting values in a standard normal random variable. Dive into examples and formulas for normal distributions.

Normal Distributions & Confidence Intervals
E N D
Presentation Transcript
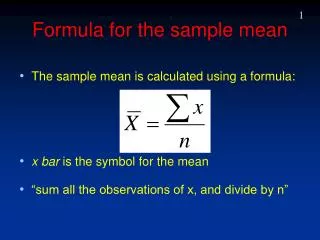
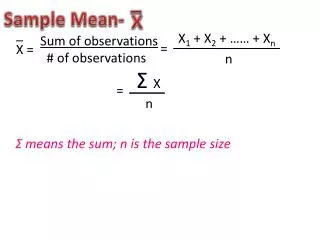
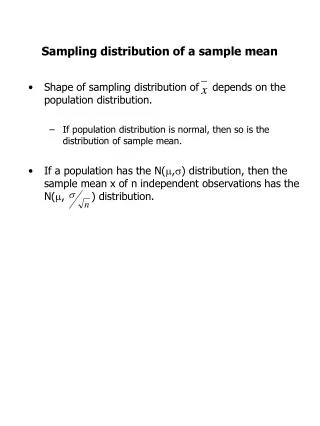
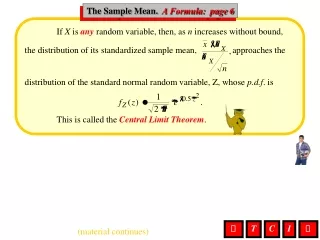
Sample Mean, A Formula If X is any random variable, then, as n increases without bound, the distribution of its standardized sample mean, approaches the distribution of the standard normal random variable, Z, whose p.d.f. is This is called the Central Limit Theorem. The Sample Mean. A Formula: page 6 T C I (material continues)
Normal Distributions, Standard Normal Normal Distributions. Standard Normal 1. STANDARDNORMAL(Mean 0 & Standard deviation 1) In The Sample Mean we derived the probability density function for the standard normal random variable Z. We can use integration and fZ to compute probabilities for Z. Example1. Compute P(0.74 Z 1.29). As we saw in Integration, To evaluate the integral open Integrating.xls and enter the function as =(1/SQRT(2*PI()))*EXP(-0.5*x^2). Recall that x is the only variable that can be used in Integrating.xls. T C I Integrating.xls (material continues)
Normal, General Normal Normal Distributions. General Normal 2. GENERALNORMAL(Any Mean & Any Standard deviation/But its standardization is a standard normal distribution) The adjective “standard”, used in standard normal distributions, implies that there are “non-standard” normal distributions. This is indeed the case. A random variable, X, is called normal if its standardization, has a standard normal distribution. It can be shown that the probability density function for a normal random variable, X, with mean X and standard deviation X has the following form. T C I (material continues)
Normal Distributions- • Standard Normal Random Variable (Z) • p.d.f. • Can use Integrating.xls to find probabilities
Normal Distributions- • Ex1. Find • Soln: show ex1 excel file
Normal Distributions • Ex. Find a number so that . • Soln:show ex2 excel file
Normal Distributions • The previous example tells us that 97.5% of all data for a standard normal random variable lies in the interval . • This means that 2.5% of the data lies above z = 1.96 • Graphically, we have the following:
Normal Distributions • The shaded region corresponds to 97.5% of all possible area (note 2.5% is not shaded) 1.96
Normal Distributions • Due to symmetry, we get 95% of the area shaded with 5% not shaded (2.5% on each side) -1.96 1.96
Normal Distributions • This means that a 95% confidence interval for the standard normal random variable Z is (-1.96, 1.96) -1.96 1.96
Normal Distributions • A 95% confidence interval tells you how well a particular value compares to known data or sample data • The interval that is constructed tells you that there is a 95% probability that the interval will contain the mean of X. • Another interpretation is that 95% of all values found in a sample should lie within this 95% confidence interval.
Normal Distributions • Possible formulas: Z Standard Normal random variable
Normal Distributions • Possible formulas:
Important • Possible formulas: If is unknown The sample standard deviation, , will be a very good approximation for
Normal Distributions • Remember, that -1.96 and 1.96 were special values that apply to a 95% confidence interval • You need to find different values for other types of confidence intervals. • Ex. Find a 99% confidence interval for Z. Find a 90% confidence interval for Z.
Normal Distributions • Soln: • Ex. What is the confidence interval for Z with 1 standard deviation? 2 standard deviations? 3 standard deviations?
Normal Distributions • Soln:
Normal Distributions • Soln:
Normal Distributions • Since Z is a standard normal random variable, Z would have standardized some variable X. • So,
Normal Distributions • Ex. Suppose X is a normal random variable with and . Find a 95% confidence interval for X if the 95% confidence interval for Z is (-1.96, 1.96).
Normal Distributions • Soln: So, the 95% confidence interval for X is (90.6, 149.4). We are 95% confident that this interval contains the true mean
Normal Distributions • Ex. Suppose X is a normal random variable. If a sample of size 34 was taken with and , find a 95% confidence interval for the sample mean-remember this is if the 95% confidence interval for Z is (-1.96, 1.96).
Normal Distributions • Soln:
Normal Distributions • Soln: So, the 95% confidence interval for is (114.9579, 125.0421). We are 95% confident that this interval contains the true mean
Normal Distributions • General Normal Random Variable • p.d.f. • Probabilities are done similarly to Standard NRV
Normal Distributions • Ex. If X is a normal random variable representing exam 1 scores with mean 75 and standard deviation 10, find . • Soln:
Normal Distributions • NORMDIST function in Excel • Can calculate p.d.f. and c.d.f. values for a normal random variable • Ex. If X is a normal random variable representing exam 1 scores with mean 75 and standard deviation 10, find .
Normal Distributions(show excel) • Soln:
Normal Distributions • Specific values for the p.d.f. can also be calculated using NORMDIST • Ex. Find height of p.d.f. of a normal random variable X at X =90 that has a normal distribution with and .
Normal Distributions • Soln: Two ways to solve=0.009 (1) Evaluate (2) Evaluate =NORMDIST(90, 71, 12, FALSE) using Excel
Normal Distributions • How does the mean and standard deviation affect the shape of the Normal Random Variable graph? • Ex. Graph the p.d.f. of a normal random variable with the following characteristics: (1) and (2) and (3) and (4) and
Normal Distributions Why? Recall-General Normal random variable p.d.f • Soln: (1) and Max Height 0.40 The y-values of the graph around x = -3 and x = 3 are very small
Normal Distributions • General Normal Random Variable • p.d.f. e^(0)=1
Normal Distributions-sec1-4/13 Why? • Soln: (2) and Max Height 0.08 (This is 0.40 std. dev.) Y values very small Around x = -15 and x = 15 (This is 3 standard deviations from the mean- )
Normal Distributions • General Normal Random Variable • p.d.f. e^(0)=1
Normal Distributions • Soln: (3) and Max Height 0.40 (At x = 4) Y values very small around x = 1 and x = 7 (This is 3 standard deviations from the mean)
Normal Distributions • Soln: (4) and Max Height 0.08 (This is 0.40 std. dev.) Y values very small around x = -11 and x = 19 (This is 3 standard deviations from the mean)
Normal Distributions • Ex. Find the mean and standard deviation for the following normal random variables graphed. (A)
Normal Distributions • Mean is 6 and standard deviation is 3
Normal Distributions • (B)
Normal Distributions • Mean is -7 and standard deviation is 2
Normal Distributions • (C)
Normal Distributions • Mean is 300 and standard deviation is 50
Normal Distributions • Relationship between p.d.f. and c.d.f. • So,