Download
1 / 8
90 likes | 247 Views
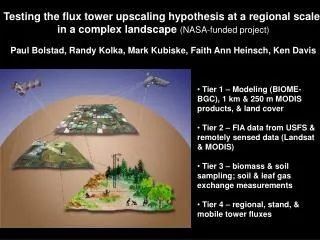
Testing the flux tower upscaling hypothesis at a regional scale in a complex landscape (NASA-funded project) Paul Bolstad, Randy Kolka, Mark Kubiske, Faith Ann Heinsch, Ken Davis. Tier 1 – Modeling (BIOME-BGC), 1 km & 250 m MODIS products, & land cover

E N D
Testing the flux tower upscaling hypothesis at a regional scale in a complex landscape(NASA-funded project) Paul Bolstad, Randy Kolka, Mark Kubiske, Faith Ann Heinsch, Ken Davis • Tier 1 – Modeling (BIOME-BGC), 1 km & 250 m MODIS products, & land cover • Tier 2 – FIA data from USFS & remotely sensed data (Landsat & MODIS) • Tier 3 – biomass & soil sampling; soil & leaf gas exchange measurements • Tier 4 – regional, stand, & mobile tower fluxes
Measurement of fluxes with towers equipped with eddy covariance instrumentations at two spatial scales 2) Stand level 30 m Results: Forest stand as CO2 sink 1) Regional level Very tall tower at WLEF 400 m Results: Region as CO2 source/weak sink Why are these results conflicting?
Mobile eddy covariance and stationary micrometeorological measurements in clearcuts and wetlands – An update Nick Saliendra Mark Kubiske Ron Teclaw Dan Baumann USDA Forest Service North Central Research Station Ecophysiological Processes Unit Forestry Sciences Lab Rhinelander, WI
Two Mobile EC Systems • 3-D sonic anemometer (CSAT3) • Open path IRGA (LI-7500) • CR5000 data logger • Measurements at 10 Hz • Half-hourly averaging • Five Micrometorological • Stations • PAR (photosynthetically active • radiation) • Temperature • Relative humidity • Precipitation • Soil H2O & temperature (clearcuts) • Depth of water table (wetlands) • Half-hourly averaging
Riley Creek (Ameba Salvage) Thunder Creek Clearcut Sites
Wetland Sites Riley Creek (Ameba Salvage) Wilson Flowage South Fork Forested Wetland (east of WLEF)