Download
1 / 37
370 likes | 498 Views
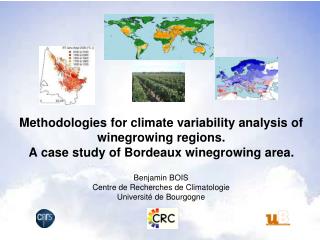
Methodologies for climate variability analysis of winegrowing regions. A case study of Bordeaux winegrowing area. Benjamin BOIS Centre de Recherches de Climatologie Université de Bourgogne. Spatial analysis of climate for viticulture. Risk management Pest management (models)

E N D
Methodologies for climate variability analysis of winegrowing regions.A case study of Bordeaux winegrowing area. Benjamin BOIS Centre de Recherches de Climatologie Université de Bourgogne
Spatial analysis of climatefor viticulture • Risk management • Pest management (models) • Frost, hail, wind, excessive drought risks • Terroir comprehension and characterization • Vineyard management • Site selection Source : RSVAH (2007), Sandoz Bindi & Maselli (2001)
10 cm 1 m 10 m 100 m 1 km 10 km 100 km 1000 km 1 cm Climate differences Uncertainty ? Climate differences > Uncertainty Spatial scale in climatology Macro-scale Meso-scale Local scale Micro-scale Leaf Canopy Plot Vineyard Region Country From Oke (1978)
Interpolation Remote sensing 11,5°C 14°C 13°C ? Meteorological models 12°C Climate spatialization
30 120 25 100 20 80 Temperature (°C) 15 60 Rainfall (mm) 10 40 5 20 RR Tmin 0 0 Tmax Mai Jan. Mar. Nov. Sept. Jul. Tmoy Bordeaux winegrowing region Normals (1976-2005) Villenave d’Ornon
Radar Rainfall Stations MODELS ET AGRO-CLIMATIC INDICES at daily time step Soil water balance Degree-days Tmin Tmax CORINE ET0 DEM Rs Sat Zoning
Zoning relevance • Is the spatialization uncertainty sufficiently low to draw reliable analysis of the spatial structure of climate ?
Predicted values vs. grapevine phenology TEMPERATURE Half-véraison (DD prediction vs. field observations) Spatialization accuracy Spatialization residuals (errors) vs. Measured spatial variability RAINFALL Comparison of several interpolation methods
Zoning relevance • Is the spatialization uncertainty sufficiently low to draw reliable analysis of the spatial structure of climate ? • Is the spatial structure redundant ?
Rainfall year-to-year variability 2004 1994
1% 1% 12% 64% 21% 1% Cool zones ( +5 to +15 days): Early cultivars (Merlot, white cultivars,…) Warm zones ( -5 to -15 days): Late cultivars (Cabernet-Sauvignon, Petit Verdot) Climate change consideration Degree.days Zoning2001-2005 period • Interclass interval : 42 to 79 DD • 5 to 11 days
Conclusions • New technologies (remote sensing, GIS, increasing computing potentialities) • More accurate interpolations, reduction of the “cost / scale dilemma”
Conclusions • The need for climate spatial analysis recommendations Numerous methods and data Ergonomic ≠ simple !
Thanks ! World classification of winegrowing regions …Work in progress… TERVICLIM (Very large scale climate analysis and modelling) Large scale climate analysis (Jones et al.) Bois (unpublished)
Résultats RMSE = 0.86°C RMSE = 0.59°C
ST Jan.-Sept. 2003 (DD) ST Jan.-Sept. 2002 (DD) Temperature 2001-2005 period Strong inter-annual variations
Tmin Tmax 1 1 0.9 0.9 OK 0.8 0.8 IDWA RMSE (°C) RMSE (°C) MRK 0.7 0.7 0.6 0.6 0.5 0.5 Year Apr. - Year Apr. - Sept. Sept. Minimal temperature vs. distance to Gironde estuary Daily temperature spatialization
N Rayonnement global • RMSE annuelle de 2,7 MJ.m-2 par jour (19,8%) • Sous-estimation : biais de -11,1% • Climatologie de la Gironde • Gradient Ouest-Est de temps clair décroissant. • Jusqu’à 20% d’écart max. en hiver, 16% en été (8% en Gironde viticole) • Effet notable du relief
Rs HelioClim-1 (MJ.m-2) 10 to 6% 6 to 1% 3 to -3% -3 to -8% -8 to -13% Urban areas Rs pyranometer (MJ.m-2) Solar radiation spatilization 2001-2005 (1826 days) Saint-Émilion village Annual RMSE = 2.7 MJ.m-2 (19.8%) RMSE Aug.-Sept. =2.9 MJ.m-2 (16.6%)
ET0 Rs • Potential Evapotranspiration : Turc Method with local re-adjustement • Annual RMSE = 0.51 (21%) • Apr.-Sept. RMSE = 0.57 (15.9%) Tmin Tmax
N Saint-emilion – “zoom” – moy. Ver mat 20 ans
ETP RMSE = 0.25 mm (11%) RMSE = 0.41 mm (17%)
ETP (prop. Interpolation T) • Données de validation croisée du processus d’interpolation des températures (MRK) • Faible propagation des erreurs d’interpolation de la température quotidienne RMSE ~ 0.05 mm
Numerous artifacts with radar rainfall estimates Ordinary kriging at different time steps RADAR Rainfall spatialization 114 days – 51 raingauges location Radar (Hydram Method) RMSE = 4.4 mm Ordinary kriging RMSE = 2.5 mm