Download
1 / 59
610 likes | 779 Views
Chapter 13 Water Resources. Case Study: The Colorado River Basin— An Overtapped Resource . Colorado River flows 1,400 miles (2,300 km) through 7 U.S. states to the Gulf of California. 14 dams and reservoirs to supply water to farmers, ranchers, industries and cities.

E N D
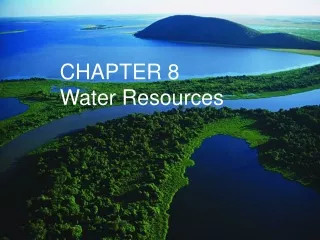
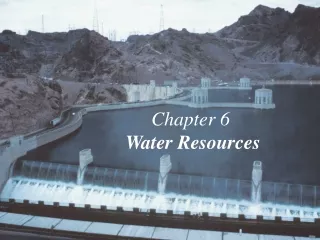
Chapter 13 Water Resources
Case Study: The Colorado River Basin— An Overtapped Resource • Colorado River flows 1,400 miles (2,300 km) through 7 U.S. states to the Gulf of California. • 14 dams and reservoirs to supply water to farmers, ranchers, industries and cities. • Supplies water and electricity for about 30 million people • Las Vegas, Los Angeles, San Diego • Located in a desert area, water supplied mostly from snowmelt of the Rocky Mountains. • So much water is withdrawn that very little water reaches the Gulf of California
The Colorado River Basin Fig. 13-1, p. 317
Aerial View of Glen Canyon Dam Across the Colorado River and Lake Powell Fig. 13-2, p. 317
Freshwater Is an Irreplaceable Resource That We Are Managing Poorly • Why is water so important? • Needed for survival • Takes huge amounts to produce food and energy • Sculpts the earth’s surface • Controls earth’s climate • Removes or dilutes pollutants and wastes that we produce
Freshwater Is an Irreplaceable Resource That We Are Managing Poorly • Access to water is • A global health issue – about 3900 children under 5 die from waterborne disease each day • An economic issue - vital to reduce poverty and produce food and energy • A women’s and children’s issue - about 50% of people do not have easy access to water • A national and global security issue - increase tension between countries • An environmental issue – declining water quality problems and overuse reduces aquifers and water tables
Girl Carrying Well Water over Dried Out Earth during a Severe Drought in India Fig. 13-3, p. 319
Most of the Earth’s Freshwater Is Not Available to Us • About 70% of Earth is covered by water…97% of it is salt water • Freshwater availability: 0.024% • Groundwater, lakes, rivers, streams • Hydrologic cycle • Movement of water in the seas, land, and air • Driven by solar energy and gravity • Not evenly distributed • Canada has .5% of world population but 20% of the liquid freshwater; China has 19% of the population and 7% of the supply; Asia has 60% of the population and 30% supply.
Condensation Condensation Ice and snow Transpiration from plants Precipitation to land Evaporation of surface water Evaporation from ocean Runoff Lakes and reservoirs Precipitation to ocean Runoff Increased runoff on land covered with crops, buildings and pavement Infiltration and percolation into aquifer Increased runoff from cutting forests and filling wetlands Runoff Overpumping of aquifers Groundwater in aquifers Water pollution Runoff Ocean Natural process Natural reservoir Human impacts Natural pathway Pathway affected by human activities Fig. 3-16, p. 67
Case Study: Freshwater Resources in the United States • More than enough renewable freshwater, unevenly distributed and polluted by agricultural and industrial wastes. • In 2005 groundwater and surface water in the US was used for: • 41% cooling power plants, 37% crop irrigation (85% in western US), 13% public water use, 9% industry and livestock. • Problems include: • Flooding, clean water shortages, drought
Average annual precipitation (centimeters) Less than 41 81–122 41–81 More than 122 Acute shortage Shortage Adequate supply Metropolitan regions with population greater than 1 million Fig. 13-4, p. 322
Natural Capital Degradation: Stress on the World’s Major River Basins Fig. 13-6, p. 323
Groundwater is Being Withdrawn Faster Than It Is Replenished (1) • Most aquifers are renewable • Aquifers provide drinking water for half the world • Water tables are falling in many parts of the world, primarily from crop irrigation (can cause subsidence) • India, China, and the United States • Three largest grain producers • Overpumping aquifers for irrigation of crops
Trade-Offs Withdrawing Groundwater Advantages Disadvantages Useful for drinking and irrigation Aquifer depletion from overpumping Sinking of land (subsidence) from overpumping Exists almost everywhere Renewable if not overpumped or contaminated Pollution of aquifers lasts decades or centuries Cheaper to extract than most surface waters Deeper wells are nonrenewable Fig. 13-7, p. 325
Case Study: Aquifer Depletion in the United States • Ogallala aquifer: largest known aquifer • Irrigates the Great Plains • Very slow recharge • Water table dropping • Government subsidies to continue farming deplete the aquifer further • Biodiversity threatened in some areas • California Central Valley: serious water depletion
Subsidence in the San Joaquin Valley Fig. 13-11, p. 327
Solutions Groundwater Depletion Prevention Control Waste less water Raise price of water to discourage waste Subsidize water conservation Tax water pumped from wells near surface waters Limit number of wells Set and enforce minimum stream flow levels Do not grow water-intensive crops in dry areas Divert surface water in wet years to recharge aquifers Fig. 13-12, p. 327
Deep Aquifers Might Be Tapped • Deep aquifers may contain enough water to provide for billions of people for centuries. • Major concerns • Nonrenewable • Little is known about the geological and ecological impacts of pumping deep aquifers • Some flow beneath more than one country • Costs of tapping are unknown and could be high
California Transfers Water from Water-Rich Areas to Water-Poor Areas • Water transferred from north to south by • Tunnels • Aqueducts • Underground pipes • California Water Project • Inefficient water use • Environmental damage to Sacramento River and San Francisco Bay
The California Water Project and the Central Arizona Project Fig. 13-16, p. 331
Provides irrigation water above and below dam Flooded land destroys forests or cropland and displaces people Large losses of water through evaporation Provides water for drinking Deprives downstream cropland and estuaries of nutrient-rich silt Reservoir useful for recreation and fishing Risk of failure and devastating downstream flooding Can produce cheap electricity (hydropower) Reduces down-stream flooding of cities and farms Disrupts migration and spawning of some fish Fig. 13-13a, p. 328
Natural Capital Degradation: The Aral Sea, Shrinking Freshwater Lake Fig. 13-17, p. 332
Removing Salt from Seawater Is Costly, Kills Organisms, Creates Briny Wastewater (1) • Desalination • Distillation: evaporate water, leaving salts behind • Reverse osmosis, microfiltration: use high pressure to remove salts • 14,450 plants in 125 countries • Saudi Arabia has the highest number
Removing Salt from Seawater Is Costly, Kills Organisms, Creates Briny Wastewater (2) • Problems • High cost and energy footprint • Keeps down algal growth and kills many marine organisms • Large quantity of brine wastes
Reducing Water Waste Has Many Benefits • One-half to two-thirds of water is wasted - subsidies mask the true cost of water by lower cost • Water conservation • Improves irrigation efficiency to lower wasted water • Improves collection efficiency • Uses less in homes and businesses
Major Irrigation Systems Fig. 13-18, p. 335
Less-Developed Countries Use Low-Tech Methods for Irrigation • Human-powered treadle pumps • Harvest and store rainwater
Chapter 20 Water Pollution
Water Pollution Comes from Point and Nonpoint Sources • Water pollution • Change in water quality that can harm organisms or make water unfit for human uses • Contamination with chemicals or heat • Point sources • Located at specific places; Easy to identify, monitor, and regulate • Nonpoint sources • Broad, diffuse areas; Difficult to identify and control; Expensive to clean up
Water Pollution Comes from Point and Nonpoint Sources • Leading causes of water pollution • Agriculture activities • Sediment eroded from the lands • Fertilizers and pesticides • Bacteria from livestock and food processing wastes • Industrial facilities • Mining • Runoff from waste rock
Nonpoint Sediment from Unprotected Farmland Flows into Streams Fig. 20-4, p. 530
Lake Polluted with Mining Wastes Fig. 20-5, p. 531
Plastic Wastes in Mountain Lake Fig. 20-6, p. 531
Major Water Pollutants Have Harmful Effects • Infectious disease organisms: contaminated drinking water • The World Health Organization (WHO) • 1.6 million people die every year, mostly under the age of 5
Common Diseases Transmitted to Humans through Contaminated Drinking Water Table 20-2, p. 532
Science Focus: Testing Water for Pollutants • Variety of tests to determine water quality and chemical analysis – check for Coliform bacteria: Escherichia coli • Level of dissolved oxygen (DO) • Indicator species • Mayfly vs. leeches • Bacteria and yeast glow in the presence of a particular toxic chemical • Color and turbidity of the water
Water Quality as Measured by Dissolved Oxygen Content in Parts per Million Fig. 20-A, p. 533
Streams Can Cleanse Themselves If We Do Not Overload Them • Dilution • Biodegradation of wastes by bacteria takes time
Global Outlook: Stream Pollution in Developing Countries • Half of the world’s 500 major rivers are polluted • Untreated sewage, Industrial waste • India’s and China’s rivers worst in the world
Natural Capital Degradation: Highly Polluted River in China Fig. 20-8, p. 535
Trash Truck Disposing of Garbage into a River in Peru Fig. 20-9, p. 536
Too Little Mixing and Low Water Flow Makes Lakes Vulnerable to Water Pollution • Less effective at diluting pollutants than streams • Little of no water flow • Can take up to 100 years to change the water in a lake • Biological magnification of pollutants
Cultural Eutrophication Is Too Much of a Good Thing (1) • Eutrophication • Natural enrichment of a shallow lake, estuary, or slow-moving stream • Caused by runoff into lake that contains nitrates and phosphates • Oligotrophic lake • Low nutrients, clear water
Case Study: Pollution in the Great Lakes • 1972: Canada and the United States: Great Lakes pollution control program • Decreased algal blooms • Increased dissolved oxygen • Increased fishing, swimming beaches reopened • Better sewage treatment plants • Fewer industrial wastes • Bans on phosphate-containing household products • Problems still exist • Raw sewage • Nonpoint runoff of pesticides and fertilizers • Biological pollution • Atmospheric deposition of pesticides and Hg
Case Study: Pollution in the Great Lakes • 2007 State of the Great Lakes report • New pollutants found • Wetland loss and degradation • Declining of some native species • Native carnivorous fish species declining • What should be done?
The Great Lakes of North America Fig. 20-12, p. 538
Ground Water Cannot Cleanse Itself Very Well • Source of drinking water • Common pollutants • Fertilizers and pesticides, Gasoline, Organic solvents • Pollutants dispersed in a widening plume • Slower chemical reactions in groundwater due to • Slow flow: contaminants not diluted • Less dissolved oxygen • Fewer decomposing bacteria • Low temperatures
Principal Sources of Groundwater Contamination in the U.S. Fig. 20-13, p. 540
Solutions: Groundwater Pollution, Prevention and Cleanup Fig. 20-14, p. 541