Download

1 / 23
230 likes | 494 Views
Indicators for Urban Air Quality. 14 th EIONET workshop on air quality assessment and management Warsaw 5-6 October 2009. Frank de Leeuw. Current set of UAQ indicators. Structural indicator Urban Audit Core set of Indicators (CSI04). In common. AirBase Data availability, uncertainty

E N D
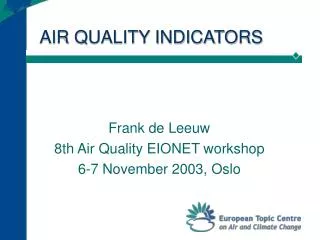
Indicators for Urban Air Quality 14th EIONET workshop on air quality assessment and management Warsaw 5-6 October 2009 Frank de Leeuw
Current set of UAQ indicators • Structural indicator • Urban Audit • Core set of Indicators (CSI04) Frank de Leeuw, 14th AQ EIONET, October 2009
In common • AirBase • Data availability, uncertainty • Time window 1997/1999 - 2007 • Comparability between countries • Comparability over time Frank de Leeuw, 14th AQ EIONET, October 2009
Structural indicator • Population exposure: PM10, O3 • Link with Questionnaire AQDirective • agglomerations • Station selection • Aggregation at EU27+-level & national, population weighted Frank de Leeuw, 14th AQ EIONET, October 2009
Results Frank de Leeuw, 14th AQ EIONET, October 2009
Urban Audit • Compliance checking; exposure • 6 sub-indicators: O3 (2), NO2 (2), PM10 (2) • Station selection by GIS overlay • No aggregation, only at city level; AQ results presented in City Profile Frank de Leeuw, 14th AQ EIONET, October 2009
CSI04: urban air quality • “Compliance checking”: population exposed to concentration > LV/TV • PM10-daily LV, NO2-annual LV, SO2 daily LV, ozone • Station selection by overlay Urban Audit • Aggregation at EEA-level from UA results Frank de Leeuw, 14th AQ EIONET, October 2009
Fraction of urban population exposed Frank de Leeuw, 14th AQ EIONET, October 2009
Population coverage: SI - CSI04 Frank de Leeuw, 14th AQ EIONET, October 2009
Comparison SI- CSI04 Frank de Leeuw, 14th AQ EIONET, October 2009
Urban vs. total population Frank de Leeuw, 14th AQ EIONET, October 2009
Sustainable health impact indicator? • Objective set in 6th EAP: “levels of air quality that do not give rise to significant negative impacts on, and risk to human health and the environment” • WHO AQG PM2.5 10 μg/m3 (annual) O3 100 μg/m3 (8h daily max) 500 (μg/m3).day (SOMO35) Frank de Leeuw, 14th AQ EIONET, October 2009
Health indicator • Distance to target: loss in health compared to the sustainable levels: AQG • Health loss expressed in ……. mortality in premature deaths or life expectancy or years of life lost morbidity expressed in ….. Frank de Leeuw, 14th AQ EIONET, October 2009
Health endpoints YOLL 52,000 € mean 120,000€ 190,000 € 83 €/day 38 €/day 38 €/day • Mortality (PM2.5, ozone) • Morbidity • chronic bronchitis (PM10) • restricted activity days (PM2.5) • lower respiratory symptoms days (PM10, ozone) • Minor restricted days (ozone) Frank de Leeuw, 14th AQ EIONET, October 2009
Annual health loss DRAFT Frank de Leeuw, 14th AQ EIONET, October 2009
Recommendations • include PM2.5 • how to present? • steamline input: AirBase UA cities & pop data • selection of cities: all, >100k, >250k ? • urban or total population? • add health impact indicator? Frank de Leeuw, 14th AQ EIONET, October 2009