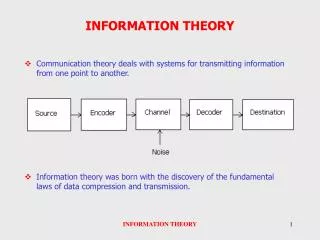
Digitization and Information Theory
Digitization and Information Theory. Digitizing information. Digitizing signals Nyquist’s theorem etc. Quantization error Quantization Channel codes Pulse Code Modulation Parity and error correction Block codes Probability and Information theory. Quantization in time.


Digitization and Information Theory
E N D
Presentation Transcript
Digitizing information • Digitizing signals • Nyquist’s theorem etc. • Quantization error • Quantization • Channel codes • Pulse Code Modulation • Parity and error correction • Block codes • Probability and Information theory
Quantization in time • Sampling rate or sampling frequency Fs • Time between samples 1/Fs. • The continuous, analog signal is converted to a discrete set of digital samples. Do we lose information between signals?
No, no loss if done right! • Examine the extreme case of very long time between samples compared to period. • Nyquist’s theorem—sample rate must be twice highest frequency in the signal
Sine becomes a square • Sine wave becomes a square wave when sampled at Nyquist rate. However, if we filter the square wave to eliminate all harmonics except the fundamental we recover the sine.
Quantization in amplitude • Number of level is typically quoted in bits, e.g. 8 bits implies 255 (28-1) levels. (do 3 bit example). • First bit represents negative or positive.
Signal to Noise ratio and Bits • If the difference between levels is Q then the maximum signal amplitude is Q2N-1. • The RMS signal is Q2N-1/√2. (Derive!) • Now what is the RMS value of the error that results because the levels are quantized? The error is uniformly distributed between levels.
Signal to Noise ratio • Signal to Noise = (Srms/Erms)2. • Example n=8 means S/N=98304.
Quantization leads to distortion • Low level signals become distorted by quantization—in an extreme example a sine wave becomes a square wave. (Low frequency) • Does Nyquist filter get rid of the higher harmonics in this case? Why or why not?
Adding Noise lessens distortion! • Dithering – intentionally adding low level noise. • Nyquist filter takes out high harmonics associated with spiky transitions. Smoothes the wave to get closer to original.
Low pass filter acts as an integrator • Vout is the average of the Vin signal if the Vin signal changes much faster then the RC filter can respond. • E.g. If duty cycle D=0.5 then Vout is half way between ymin and ymax
Transmitting and storing digital information—Pulse Code Modulation • Pulse Code Modulation is the most common method to store and transmit digitized signals. In PCM the digitized value in each time window is stored as a binary number. • In PCM the values are listed sequentially, I have highlighted the 4 bit words in the example—in practice the receiver knows the number of bits of digitization 0010010101100110010100110001101011011101
Channel Codes: transmitting PCM data • Return To Zero (RTZ) representation of 10101
Non Return to Zero (NRZ) • Representation of 101011(red lines indicate time divisions for each bit)
Modified Frequency Modulation (MFM) • Representation of 101011 (Transition means 1)
Phase Encoding • Negative going transition = 1 • Positive going transition = 0 • Representation of 101011 • Self clocking
Parity and Error correction • Error correction: most transmission methods and media for storage of information are unreliable. E.g CD writers make an average of 165 errors per second. • We insert redundancy—extra information, to allow us to detect and correct errors. • English is redundant • Thx dgg ape my homtwork
Parity Bit • Add an extra bit: 0 if there an even number of 1’s in a binary word; 1 if there is an odd number of 1’s in a binary word. Word Parity bit 1001 0 1101 1 1111 0 0001 1 After every 4 words add an extra parity word.
ISBN Numbers on Books • The last digit of an ISBN number is a type of parity called a checksum bit. • Modulo 11 parity systems. • Example:0-89006-711-2 0x10+8x9+9x8+0x7+0x6+6x5+7x4+1x3+1x2=207 • The last number is chosen to make the total add up an integer multiple of 11. • 2x1 added to 207=209=11x19 (with no remainder).
Block Codes • Block codes not only find error but locate and correct without the need for retransmission. 1001 0 1001 00 1101 1 11011 1 0110 0 01111 0 0011 0 00110 0 0001 0000 0001 red-parity; green-calculated parity; purple-bad bit
Information • How can we quantify information? • Information content in a message is a measure of the “surprise”. Sounds abstract, but surprise is related to the probability of the message. Highly unlikely message contains a lot of information and vice versa. • We must do a quick review of the mathematics of probability.
Probability • Probability is a statistical concept. The probability of an event is determined by the result of repeated independent trials. Probability is the ratio of the number of outcomes of a particular result divided by the total number of trials. • Some probabilities are obvious by symmetry: E.g. tossing a coin p(H)=0.5, p(T)=0.5. • Some require an actual test. E.g. tack tossing.
Probability • Probability is a dimensionless number between 0 and 1. • Does probability depend on history? If I flip 25 heads in a row is a tail more likely on the next toss?
Probability of independent events • The probability of two events A and B occurring one after another is the product of the probabilities p(AB)=p(A)p(B). • Example: What is the probability of a couple’s first two children both being boys? What are the odds of 3 boys in a row? • Probability trees—a diagram method to plot out all outcomes along with their probabilities. Total probability of all outcomes must be 1.
Probability of dependent events • Dependent events—first trial affects the probabilities of the second. • Be careful of dependent events—e.g. taking cards from a deck: Odds of 2 kings dealt as the hidden cards in a Texas Hold’em hand. • Odds of a flush dealt from a complete deck.
Averages with probability • The average of some set of quantities whose probabilities are known is given by the sum of the probability value product from all possible values. • Example: What is the average value of a single die thrown many times? • Example: Random walk.
Entropy • A system tends to move towards its most likely configuration. This configuration is the most random. Entropy is a measure of randomness. • Example 1. List all the states of 4 coins. What mix of heads and tails is most likely? • Example 2. 100 coins on a tray all with heads facing up. Is this high or low entropy? Now intermittently whack the tray flipping a few coins. Which direction does the distribution of heads and tails go?
Encoding • PCM can often be a very inefficient means of sending information. • The efficiency of information storage or transmission can be increased by using short codes for frequently used symbols and longer codes for less frequently used symbols. • Example consider a data source with 2 symbols: A with probability p(A)=0.8 and B with probability p(B)=0.2.
Compression Example ABAAAABAAAAABABAAAAAAAABABAAAA 0 1 0000 100000 1 01 0000000001 01 0000 30 digits 10 0 0110 0 0110110 0 0 0 10 10 0 0 24 digits 101 0 110 0 11101 0 0 100 101 0 22 digits Code 1: The obvious code A=0 B=1. Symbol Probability Representation # Digits A 0.8 0 0.8 B 0.2 1 0.2 1.0 Conclusion: 1 digit per letter.
Other encoding schemes • Code 2: Group pairs of letters Symbols Prob. Representation #digits AA 0.64 0 0.64 AB 0.16 10 0.32 BA 0.16 110 0.48 BB 0.04 111 0.12 1.56 1.56 digits for 2 bits i.e. 0.78 digits per letter.
Yet another coding scheme • Code 3: group in 3’s. Symbols Prob. Representation #digits AAA 0.512 0 0.512 AAB 0.128 100 0.384 ABA 0.128 101 0.384 BAA 0.128 110 0.384 ABB 0.032 11100 0.160 BAB 0.032 11101 0.160 BBA 0.032 11110 0.160 BBB 0.008 11111 0.040 2.184 2.184 digits for 3 bits, i.e. 0.728 digits per letter
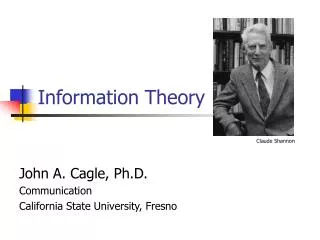
Information Theory • Claude Shannon (1948) – quantitative study of information. • Postulates • A signal consists of a series of messages each conveying information from a source. The information is unknown before its arrival. • Each message need not contain the same amount of information. • The information content can be measured by the degree of uncertainty which is removed upon the arrival of the message.
Additive not Multiplicative scale • We want a measure of information that is additive. As each message of a signal arrives it should carry a certain amount of information that adds to the previous information. • Information is related to probability—but probabilities combine multiplicatively. How can we change x to +? Log scale. • Example: Hats 3 sizes, 2 colors.
Information content of a message • Information content in a message • Note log to the base 2. Why? Because information age is binary i.e. a two level system. • Why the negative?
How do I find log2(y) • Remember the definition of a log. In the equation below x is log2 (y). • Take log10 of both sides
Info content of a signal • We defined the information content of a single message. The info content of a message is the average information content for a large number of messages that make up a typical signal. For a signal with n possible messages the average info per message is
Example • Letters of the alphabet (26 of them). Assume they occur with equal probability in a message pi=1/26 • Average information content per message is
What does 4.7 mean? • 4.7 bits per message is the average information content per message. Compare this number to the number of bits required to send 26 letters. How many? 5 bits (25=32 so we have a few left over). • Example: A gauge has 100 levels—how many bits are required to encode the information if every level is equally probable. How about p1=0.5 and p2-100=1/198?
Efficiency and Redundancy • Code efficiency is defined as • Where I is the average info content and M is the number of encoding bits. • Code redundancy = M-I bits/message
Huffman Code • A method to create an efficient code if the message probabilities are known. • Form the Huffman tree: • list messages in descending order of probability. • Draw a “tree” to combine the least likely pairs of signals first. • Keep grouping until all are paired. • Start with 1 and 0 at the far end of the tree. Move back adding 1 and 0 at each junction. • Read from end of tree to each message to get code
Example • The signal contains 7 messages with probabilities as shown below:
What is the number of bits per message using the Huffman code?
What is the theoretical minimum number of bits per message using information theory? • Iave = 0.305log2(0.305) + 0.227log2(0.227) + 0.161log2(0.161) + 0.134 log2(0.134) +0.098 log2(0.098) + 0.05log2(0.05) + 0.024log2(0.024) =2.494 bits per message.
Redundancy and efficiency • Actual code value I = 2.54 bits per message • Minimum value M=2.494 bits per message • Redundancy = M – I =2.54-2.494 = 0.046 bits per message • Efficiency