Download
1 / 52
530 likes | 656 Views
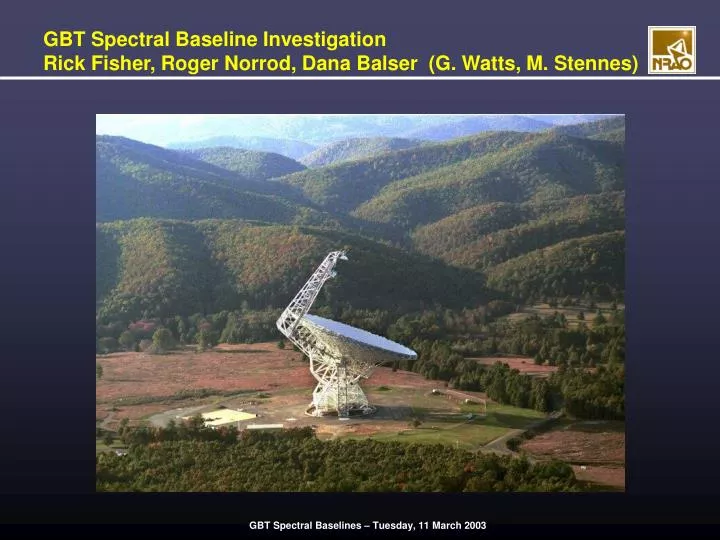
GBT Spectral Baseline Investigation Rick Fisher, Roger Norrod, Dana Balser (G. Watts, M. Stennes). Points to Note:. Wider bandwidths than were used on 140 Foot Cleaner antenna so other effects show up Larger antenna: 1. Reflections have longer paths

E N D
GBT Spectral Baseline InvestigationRick Fisher, Roger Norrod, Dana Balser (G. Watts, M. Stennes)
Points to Note: • Wider bandwidths than were used on 140 Foot • Cleaner antenna so other effects show up • Larger antenna: 1. Reflections have longer paths • 2. Higher Ta on continuum sources • Our tests intentionally provoked baseline distortions
Talk Outline Baseline Distortion Points Antenna Receivers IF system Spectrometers RFI Observing Strategies Continuing Work
Total Power Observations “ON” - “OFF” Gsrc(f) * Tsrc(f) -------------------- = --------------------------------- “OFF” Gsys(f) * Tsys(f)
Antenna Noise Spectrum Background Atmosphere Spillover
(ON - OFF) / OFF Spectra (1.4 GHz)Sub-reflector has been displaced for ON scanRed: horizontal pol’n; Green : vertical pol’n
Periodogram of 1/8-wavelength Sub-reflector Displacement Spectra (1.4 GHz)Red: horizontal pol’n, Green: vertical pol’n
21-cm Frequency Switched Spectrum (Ta/Tsys)(BW = 40 MHz; Delta-f = 1 MHz)
(ON – OFF)/OFF Spectra (5 Ghz)Sub-reflector has been Displaced for ON scanRed: horizontal pol’n, Green: vertical pol’n
Periodogram of 1/8-wavelength Sub-reflector Displacement Spectra (5 GHz)Red: horizontal pol’n, Green: vertical pol’n
Periodogram of 1/8-wavelength sub-reflector displacement spectra(9 GHz, BW = 800 MHz)
(ON – OFF)/OFF Continuum Source Spectra (1.99 GHz; Flux = 5.7 Jy)Red: channel X, Green: channel Y
(ON – OFF)/OFF Continuum Source Spectra (1.99 GHz, Flux=5.7 Jy)Red: channel X, Green: channel Y
Periodograms of Continuum Source Spectra (1.99 GHz, BW = 200 MHz)Red: channel X, Green: channel Y
(ON – OFF)/OFF Source Continuum Spectra (1.4 GHz) 5.08 Jy 4.68 Jy 2 x 2.21 Jy
Composite Continuum Source Spectrum (1.4 GHz, Flux = 4.68 Jy)Red: channel X, Green: channel Y
Continuum Source Spectrum (5 GHz, Flux = ~5 Jy)Red: channel X, Green: channel Y
Ku-band Receiver Total Noise Power15.2 GHz (top left) to 11.7 GHz (bottom right)
Ku-band Receiver Total Noise Power (copper tape over gap)15.2 GHz (top left) to 11.7 GHz (bottom right)
Continuum Source Baseline Strategies Reduce small-scale structure in receiver noise Verify LNA/OMT/Feed noise structure (improve designs) Calibrate with strong continuum sources
NGC7027 Continuum Spectra (5 GHz, Flux = 5.4 Jy)5-minute ON, 5-minute OFFRed: channel X, Green: channel Y
Ratios of NGC7027 Continuum Spectra (5GHz, Flux = 5.4 Jy)11 Minute Intervals for 3 HoursNote: spectra offset for illustration
Ratios of 3C48 to NGC7027 Continuum Spectra (5 GHz)Red: channel X, Green: channel YNote: spectra offset for illustration (on-off)/off (on-off) (on-off)
Ratio of Continuum Spectra of 1042+1203 between Beam Center and Roughly Half Power Points (1.4 GHz) North East West South
Total Power IF Spectrum Sample (3 GHz)2.4 MHz Ripple Period in Optical Modulators
Frequency Dependence of Optical Modulator Gain Ripple Amplitude
Total Power IF Spectrum Sample of Modified Modulator (3 GHz)
IF Spectrum Autocorrelation FunctionRed: original modulator, Green: modified modulator
Correlation of IF Ripple Amplitude with Temperature 62-MHz Ripple Amplitude Rack Air Temp. Room Temp.
IF Spectrum Difference due to 19mm Change in 6-GHz Cable Length betweenOptical Receiver and Converter Module (63 MHz Ripple)
Detected IF Ripple Periods for 8 IF ChannelsPeriod = 800 MHz / FFT Channel
General Strategy Stabilize 63 MHz ripple (phase-stable cables) Re-measure (and fix) other IF spectrum ripple periods Return to receiver stability measurements
Other Sources of Baseline Problems Spectral Processor quantization (?) RFI
(Tsys / Tcal) for Different Spectral Processor Input Levels (BW = 40 MHz)Red: -5 dBm, Green: -12 dBm, Blue: -15 dBm
Other Sources of Baseline Problems Spectral Processor quantization (?) RFI
1.4 GHz, 10 MHz BW, Spectral Distortion Probably due to Wideband RFI orReceiver Overload due to RFI; ~ 40 seconds duration
20 GHz System Temperature Note: Two Curves use Different IF and Spectrometer Channels Receiver L2 Receiver L1
20 GHz Continuum Spectrum of 3C123, Receiver R2Successive 5-minute ON-OFF Pairs