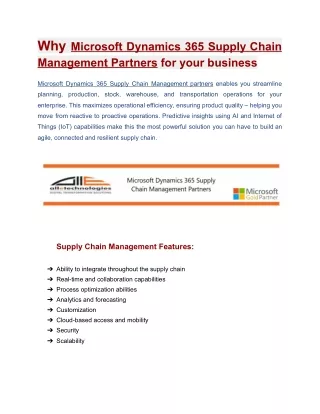
Download
1 / 4
40 likes | 65 Views
Here is how to improve Supply Chain in Manufacturing Industry with Dynamics 365 Map Visualization.

E N D
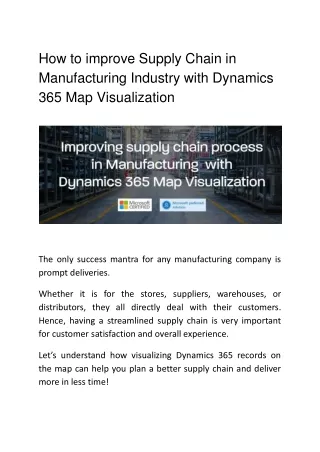
How to improve Supply Chain in Manufacturing Industry with Dynamics 365 MapVisualization The only success mantra for any manufacturing company is promptdeliveries. Whether it is for the stores, suppliers, warehouses, or distributors, they all directly deal with their customers. Hence, having a streamlined supply chain is very important for customer satisfaction and overallexperience. Let’s understand how visualizing Dynamics 365 records on the map can help you plan a better supply chain and deliver more in lesstime!
SalesTeam By visualizing their suppliers and distributors on the map, the sales rep can plan their visits with the help of an optimized route. When on the field, they can optimize the route with navigation. As a result, they can plan more meetings with the distributors in a single day and improve their overall performance. By using features like territory visualization, reps can see where the distributors and other stakeholders lie. And they can have a quick glance at each of the assigned ones. In case any appointment gets canceled, they can search for other distributors with the help of nearby features along theroute. ServiceTeam To meet customers on time or in any urgent case, service reps can follow optimized routes on the map. While on the map,withthehelpofQuickInsightandReports,theycan monitorthe requirements area from arecoming whichthemostcustomer andmanagethatterritory accordingly. A rep can also record their arrival and departure for the location of a visit with the Check-In/Check-Out feature of Quick Maps for Dynamics CRM mapintegration.
In order to deliver services quickly, service reps can visualize the nearby area of service around a customer and add to the credibility and performance of theorganization. Supply ChainDelivery When delivering, managers can visualize their clients on the map and meet the requirements by assigning the territories to the reps. After being assigned, reps can use the Optimized Route feature with Visualized Contacts enabled on the map to deliver goods by using the Auto-Scheduling feature. After delivering the goods to the required location, they can record the timings with Check-in and Check-out features to let the managers know that the job is done. Managers can stay connected to the reps when they are on-field with the Live tracking feature. In case they need any help upfront, managers can offerhelp. Marketing With the visualized data on a map, the marketing team can target campaigns for particular locations. They can use concrete data from the map to perform the marketing activities for the right times. Location lists, marketing lists, etc. can be availed for future product launches and improve the overall performance regionwise.
Quick Maps: #1 Planner for SalesTeam So much can be done with map visualization and you can tap into potential untouched locations. In that case, you can opt for a Free Trial of Quick Maps and find out whether it can suit your requirements ornot! To get a free trial of 30 days you can visit the website or MicrosoftAppSource. OriginalBlog: https://www.appjetty.com/blog/how-to-improve-supply-chai n-in-manufacturing-industry-with-dynamics-365-map-visualiz ation