Download
1 / 23
230 likes | 248 Views
This analysis compares employment data at Companies P and Q in 2005. Determine modes, medians, and means without calculating. Find out which company has a higher mean work tenure. Evaluate employee work years distribution. Solve a picture frame buying scenario and percentage problems.

E N D
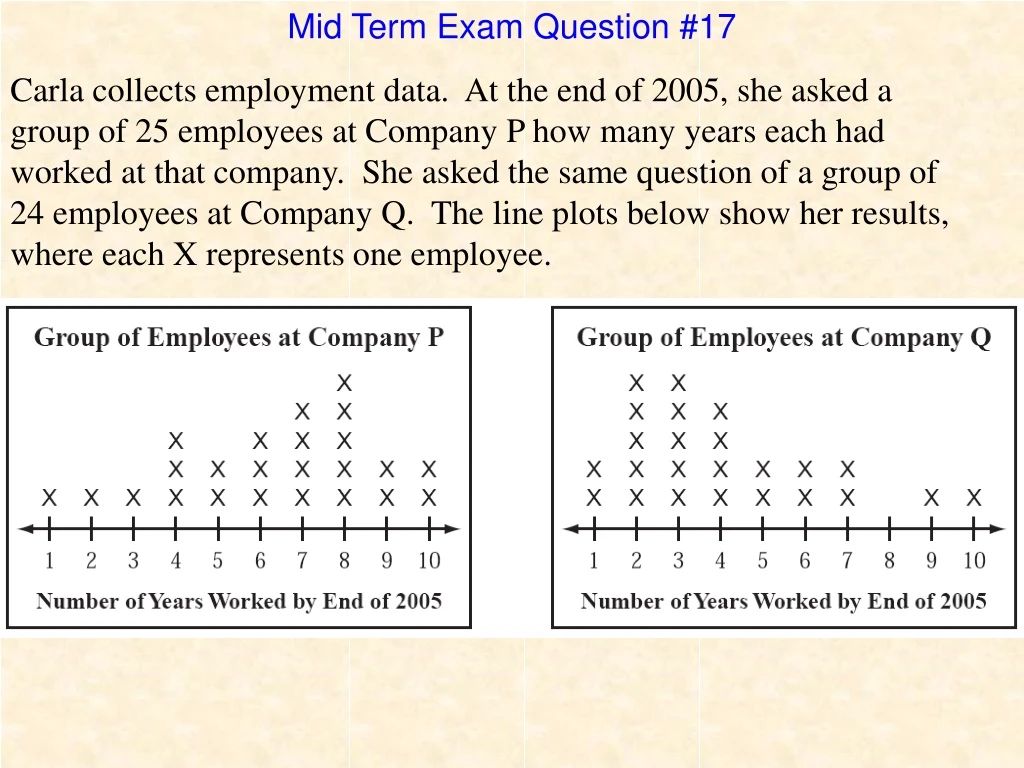
Mid Term Exam Question #17 Carla collects employment data. At the end of 2005, she asked a group of 25 employees at Company P how many years each had worked at that company. She asked the same question of a group of 24 employees at Company Q. The line plots below show her results, where each X represents one employee.
Mid Term Exam Question #17 For the group of employees at Company P, what was the mode for the years worked by the end of 2005?
Mid Term Exam Question #17 For the group of employees at Company P, what was the median for the years worked by the end of 2005?
Mid Term Exam Question #17 For the group of employees at Company Q, what was the mode for the years worked by the end of 2005?
Mid Term Exam Question #17 For the group of employees at Company Q, what was the median for the years worked by the end of 2005?
Mid Term Exam Question #17 Without computing the mean for either group, which group of employees has the greater mean number of years worked? Most of the employees at Company P have more than 5 years while most of the employees at Company Q have less than 5 years?
Mid Term Exam Question #17 Serena bought some small and large picture frames. She paid $3 for each small frame and $5 for each large frame. She bought a total of 10 picture frames and paid a total of $36. How many LARGE picture frames did she buy? Let S represent the number of small picture frames and L represent the number of large picture frames that she bought
Mid Term Exam Question #17 She paid $3 for each small frame and $5 for each large frame. She bought a total of 10 picture frames and paid a total of $36. How many LARGE picture frames did she buy?
Cluster 3-C-3 Data Displays Practice #1 Using the given pictograph, what percent of the total number of cars sold at Thrifty’s in September did Dan sell?
Cluster 3-C-3 Data Displays Practice #2 What percent of Tim’s exercise program is dedicated to running?
Cluster 3-C-3 Data Displays Practice #3 If Metropolis has 42,000 homes, how many are NOT heated with Natural Gas?
Cluster 3-C-3 Data Displays Practice #4 The line plot below shows the scores on an 80 point test. What are the mean, median and mode?
Cluster 3-C-3 Data Displays Bar Graphs Used to compare amounts What was the percent increase in student enrollment from 1990 to 1991?
Cluster 3-C-3 Data Displays Pictographs Used to compare amounts by using symbols How many more townhouses were built in Fox Hill than in The Woods?
Cluster 3-C-3 Data Displays Pictographs Used to compare amounts by using symbols The number of townhouses in Deerfield is what percent of the number of townhouses in Hudson Hills?
Cluster 3-C-3 Data Displays Histograms Like a bar graph, but used to compare frequencies How many people under the age of 19 were at the concert?
Cluster 3-C-3 Data Displays Histograms Like a bar graph, but used to compare frequencies How many people between the ages of 25 and 36, inclusive, were at the concert?
Cluster 3-C-3 Data Displays Line Graphs Shows continuous change over time What is the average population growth PER YEAR?
Cluster 3-C-3 Data Displays Line Graphs Shows continuous change over time At this rate, what would you expect the population to be in 2020?
Cluster 3-C-3 Data Displays Line Plot Like a histogram, it compares frequencies What is the median age of the Haversham cousins?
Cluster 3-C-3 Data Displays Line Plot Like a histogram, it compares frequencies What is the mean age of the Haversham cousins?
Cluster 3-C-3 Data Displays Line Plot Like a histogram, it compares frequencies What is the mode age of the Haversham cousins?