Download
1 / 11
110 likes | 124 Views
As a software developer, choosing a barcode engine to integrate that has the best speed, accuracy, robustness, and customer support becomes a crucial step in the success of a barcode scanner application. In this article, we are going to discuss evaluation of barcode scanning accuracy and tips on achieving a higher accuracy.<br><br>To know more read this blog:<br>https://www.dynamsoft.com/blog/insights/barcode-scanning-accuracy-benchmark-and-comparison/<br><br>#Barcodereader<br>#BarcodeScanner<br>#BarcodeScanningAccuracy<br>#Scanbarcode<br>#barcodereaderSDK<br>

E N D
Barcode Scanning Accuracy Benchmark and Comparison Have you considered how many barcodes you come across on a daily basis? From UPC codes on every product on the grocery shelf to PDF417 barcodes on your driver’s license, barcodes are widely adopted for their convenience and low-cost factors. Accuracy is a key metric of barcode reading SDKs. Given an image, a barcode engine should correctly detect whether one or more barcodes exist. If barcodes exist, the percentage of correct values returned dictates the accuracy. As a software developer, choosing a barcode engine to integrate that has the best speed, accuracy, robustness, and customer support becomes a crucial step in the success of a barcode scanner application. In this article, we are going to discuss evaluation of barcode scanning accuracy and tips on achieving a higher accuracy. How to Evaluate Barcode Scanning Accuracy There are two steps to read a barcode: 1. Detection (AKA localization) – Upon initiating a scan, a barcode engine scans the entire width of an image trying to identify whether there are barcode candidates. One or more coordinates of quadrilaterals are returned. 2. Decode (AKA recognition) – Once the regions of interest are identified, decoding is then initiated. In this step, the barcode scanner tries to unravel the encoded data. Corresponding to the two steps, some datasets mark up the coordinates of the barcode candidates, while others mark up the barcode encoded values. Both approaches can be used to compare different barcode scanning engines.
This article uses the barcode values to measure barcode scanning accuracy. We will discuss the datasets in the following section. Barcode Engines In this comprehensive analysis, we put the Dynamsoft Barcode Reader SDK through several barcode datasets. The same testing technique and methodologies can be applied to testing other barcode engines. We will compare Dynamsoft’s barcode SDK against another commercial barcode SDK and two popular open source solutions, Zbar and ZXing . Metrics to Evaluate Accuracy In this article, we use precision and reading rate to evaluate the accuracy. The precision is the number of correct results divided by the number of all results, including those not identified correctly. A precision of 100% means each of the results is correct, although some barcodes might be missed. Precision = correct results / all returned results The reading rate is the number of correct results divided by the number of all barcodes. A precision of 100% means that all the barcodes were recognized successfully, although there might be wrong values mixed in with the results. For example, if a barcode is mistakenly recognized as two separate ones, this behavior would not lower the reading rate. Reading rate = correct results / all barcodes Datasets Used For This Article
We have compiled a table of existing publicly available barcode datasets. Artelab Medium Muenster DEAL Lab’s Dataset Barcode 1D BarcodeDB Barcode Dataset Collection Symbologies EAN13 EAN13, UPC-A EAN13 Include images No No No with multiple barcodes Number of images 430 1054 2000 Barcodes are Barcodes are Resolutions range relatively large relatively large Image quality from 400x217 to compared to the compared to the 3480x4640 image size image size
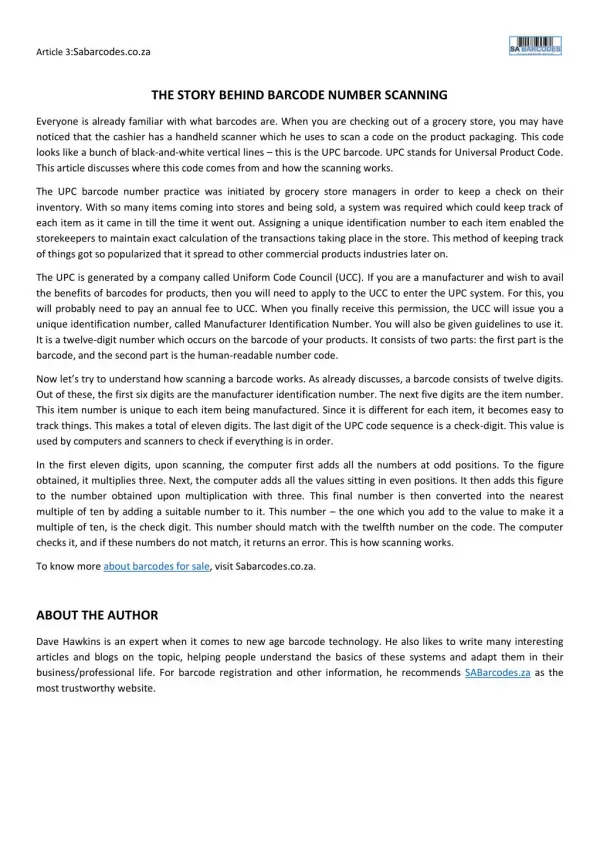
http://artelab.dista .uninsubria.it/dow https://www.uni-m nloads/datasets/b https://www.resl.k uenster.de/PRIA/e Web page aist.ac.kr/doc/data arcode/medium_b n/forschung/index. sets arcode_1d/mediu shtml m_barcode_1d.ht ml Considerations on Measuring Accuracy and Choosing Datasets Since their invention, barcodes have gained wide use. The diversity in barcode symbologies and usage scenarios make measuring accuracy complex. Symbology Different industries have adopted different barcode symbologies for their specific uses. Some barcodes, like QR codes, have built-in error detection and correction. Error detection and correction ensures that misreading is almost impossible. Others, such as 1D barcodes, use accompanying texts to verify the encoded message. Accompanying texts are human-readable characters that exist below the barcode. Verification of the accompanying texts against the scanned barcode value significantly improves the accuracy to almost 100%. Video vs. Image When scanning barcodes from a video stream, multiple frames from the video are captured and scanned for barcodes. The decoded barcode results are compared with the values from adjacent frames to improve the reading accuracy.
The datasets used in this test are static images only. One vs. Multiple Barcodes in an Image As we know, there are two steps to barcode scanning — detection and decoding. When there are multiple barcodes present in an image, especially of different symbologies, identifying the barcode zones becomes difficult. The presence of other barcodes creates a form of noise when trying to localize a single barcode zone. The more barcodes there are, the more difficult it is. To measure the success rate for datasets with multiple barcodes, there are two options: image-based vs. barcode-based. The barcode-based option is favored for its simplicity. Image Quality Barcodes can appear in all kinds of places. The images of the barcodes often come with defects, such as glare, blur, curve, a portion of the barcode on the full image, distance, stains, and background texture. To generate or select a comprehensive dataset, we need to put all these bad qualities into consideration. Performance Test Results We ran a performance test on the three datasets mentioned above. The annotations are examined and corrected manually to avoid errors. Note: 1. If a barcode is recognized as UPC-A and the ground truth is in EAN13 format (the EAN13 format has one extra leading zero), it is considered as correct. 2. Some images contain multiple barcodes while in the annotation, only one barcode is annotated. If the SDK reads the unannotated barcode, it is not considered as mis-read.
Performance Test Result on Artelab Medium Barcode 1D Collection The Artelab Medium Barcode 1D Collection has two sets of images. Dataset 1 contains pictures of barcodes taken from devices with the autofocus (AF) function. Dataset 2 contains pictures taken by devices without AF. Each of the datasets has 215 images. The test result on dataset 1: SDK pyZbar Dynamsoft Barcode Reader Commercial SDK A ZXing-CP P v0.1.8 v8.6 v5.19 v1.2.0 Correctly recognized 213 out of 215 197 out of 215 177 out of 215 193 out of 215 Misread 2 0 1 1 Reading rate 99.07% 91.63% 82.36% 89.77% Precision 99.07% 100% 99.44% 99.48% The test result on out-of-focus images dataset 2:
SDK pyZbar Dynamsoft Barcode Reader Commercial SDK A ZXing-CP P v0.1.8 v8.6 v5.19 v1.2.0 183 out of 215 169 out of 215 Correctly recognized 22 out of 215 30 out of 215 Misread 4 1 2 8 Reading rate 85.12% 79.07% 10.23% 13.95% Precision 97.86% 100% 91.67% 78.95% Performance Test Result on Muenster BarcodeDB The dataset contains 1054 valid barcode images in real-life. It covers typical distortions, such as inhomogeneous illumination, reflections, or blurriness due to camera movement. Here is the detailed performance test result: SDK pyZbar Dynamsoft Barcode Reader Commercial SDK A ZXing-CP P v0.1.8
v8.6 v5.19 v1.2.0 1025 out of 1054 Correctly recognized 984 out of 1054 792 out of 1054 744 out of 1054 Misread 5 0 1 34 Reading rate 97.25% 93.26% 75.14% 70.59% Precision 99.51% 100% 99.87% 95.63% Performance Test Result on DEAL Lab’s Barcode Dataset Images in the DEAL Lab’s barcode dataset are EAN-13 single barcodes and have various sizes and formats. It has 2000 images for testing. SDK ZXing-CPP pyZbar Dynamsoft Barcode Reader Commercial SDK A v1.2.0 v0.1.8 v8.6 v5.19
1835 out of 2000 Correctly recognized 1221 out of 2000 1264 out of 2000 1452 out of 2000 Misread 20 0 26 9 Reading rate 91.75% 61.05% 63.20% 72.60% Precision 98.92% 100% 97.98% 99.38% Conclusion We can see that the Dynamsoft Barcode Reader has the highest reading rate on the three datasets. The Dynamsoft Barcode Reader can read more blurred barcodes. You can check out this video to learn more: Dynamsoft Barcode Reader’s Techniques to Improve Accuracy Confidence Level Dynamsoft allows developers to refine barcode results by adjusting the confidence level, which determines whether the result should be kept and discarded. For general scenarios, the value of confidence level should be set to 30 of 100, which leads to a 99.873% barcode recognition accuracy according to the test report from Dynamsoft’s
QA team. The confidence level may be varied based on different datasets of barcode images. In addition to the confidence level, the following techniques are also applied to guarantee the barcode recognition accuracy: ● API for comparing adjacent frames ● Dynamsoft Camera Enhancer for filtering out blurry frames ● OCR of the accompanying text for verification Verify the Results Between Adjacent Frames Since version 8.6 for mobile, Dynamsoft Barcode Reader added a new method enableResultVerification to verify the barcode result between adjacent frames before returning it. The code for this method is as follows: reader. enableResultVerification ( true ) // To check the status of this mode: boolean x = reader. getEnableResultVerificationStatus () ; This will filter out the misread barcode results efficiently by comparing with an internal frame queue. Filter Out Blurry Frames Dynamsoft Camera Enhancer is a module that features camera control, image processing, and image enhancement. It mainly works as an extension of Dynamsoft Barcode Reader to filter out blurry images on Android and iOS (the JavaScript edition is coming soon). The higher quality of images you get, the more accurate the barcode recognition will be. OCR of the Accompanying Text
Dynamsoft Label Recognition is an OCR SDK developed based on deep learning. It trained a Caffe model for getting a high text recognition rate. The barcode orientation returned by barcode localization is utilized by the OCR SDK to precisely recognize the accompanying text around a barcode. The barcode text result is then verified by comparing the OCR result. Conclusion Choosing the right SDK ensures a fast go-to-market timeline, cutting down development and maintenance costs. High scanning accuracy also means happy end-users and overall better customer satisfaction. Dynamsoft Barcode Reader is a robust and reliable barcode SDK. It brings high accuracy for single barcode and multi-code recognition. Accuracy is the competitive advantage of Dynamsoft Barcode Reader. With a world-grade barcode detection algorithm, OCR algorithm, and camera enhancing functionality, Dynamsoft Barcode SDK is dependable and productive for personal developers and enterprises.