Download
1 / 61
610 likes | 631 Views
Structural changes in land management in selected countries of the EU after 2000. d r hab. Adam Sadowski, prof. UwB. Results of the presentation are based on the research tasks of the Jean Monnet Networks project No. 564651-EPP-1-2015-1-SK- EPPJMO-NETWORK

E N D
Structuralchanges in land management in selectedcountries of the EU after 2000 dr hab. Adam Sadowski, prof. UwB Results of the presentation are based on the research tasks of the Jean Monnet Networks project No. 564651-EPP-1-2015-1-SK- EPPJMO-NETWORK “Sustainable Land Management Network“
Structure of the presentation • Introduction – few words about farm structure • Material and methods • General data aboutPolishagriculture • Use of agricultural land • Plant production • Animal productiona • Comparsion Poland and Baltic countries agriculture • Conclusion
Material and methods • The aim of the presentationis the process of agricultural changes in Poland and Balticcountries (Estonia, Latvia, Lithuania) in the decade of the integration (2004-2014) • The presentationis based on statistical data (Polish Central Statistical Office and EUROSTAT)
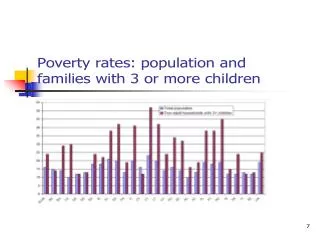
What about farm structure in Poland? • about1400thousand farms over 1 ha • over 700thousand farms have less than 1ha • ~ 60% of individualfarms have less then 5 hectares and they cultivate about 20% of total agricultural area • intensive process of losing farms operating 1-2 hectares
What about farm structure in Poland? • only about 1083 thousand farms had an economically viable size of at least 1 ESU • about 21% of the farms produce mainly for their own consumption • the farms over 1 ESU employ 2,7 mln people • an average there is about 0,48 ha of agricultural land per 1 citizen (for example in Benelux countries it is about 0,18 ha)
What about farm structure in Poland? • about 21% of the farms produce mainly for their own consumption • an average there is about 0,48 ha of agricultural land per 1 citizen (for example in Benelux countries it is about 0,18 ha) • the structure of farms demonstrates a great regional variety
What about farm structure in Poland? • It should be noted that in ten years agricultural area of farms decreased by nearly 3.3% (an average of about 0.33% per year). The reasons for this should be seen primarily in the massive pressure on other areas of the economy that taking over agricultural land for other purposes. Similar changes occur in the whole Europe and for example in the UK in the last ten years the average annual loss of agricultural land was about 0.2%.
What about farm structure in Poland? • Polish (Balticcountries) accession to the EU changed conditions of the farms. Farmers started to use the system of subsidies which mobilized a large number of them to take a more active farming.
What about farm structure in Poland? • It should be noted that from 2010 the Polish Central Statistical Office (GUS)applied the new definition of a farm according to which, farms do not include holders of agricultural land is not conducting agricultural activities and holders of up to 1 ha of agricultural land engaged in agricultural activities on a small scale. This results in significant changes in some values for these same years.
The average size of an individual farm with an area exceeding 1 ha of agricultural land in Poland
The average area of agricultural land in organic farms in Poland
Agricultural production (in constant prices of the previous year) per 1 ha of agricultural land in zł in Poland
The number of animals in the regions on100 hectares of farmland in Poland