Download
1 / 23
230 likes | 264 Views
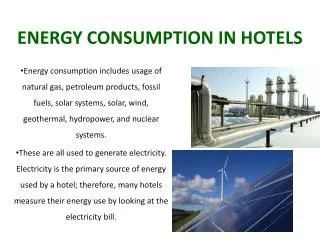
This study focuses on developing a model to assess energy consumption in Greek hotels, utilizing top-down and bottom-up approaches. It analyzes the energy efficiency requirements set by EU and Greek legislation to improve building performance.

E N D
Promitheas 7-8.10.2010 Creating a hotel building stock model focused in energy consumption S.N. Boemi, Y. Mihalakakou Department of Environment and Natural Resources Management University of Ioannina A.M. Papadopoulos Laboratory of Heat Transfer and Environmental Engineering Department of Mechanical Engineering Aristotle University of Thessaloniki
Final Energy Consumption by sector LHTEE Greece final energy consumption covers energy supplied to the final consumer’s door for all energy uses. Services is the fastest growing sector with the 2007 final energy consumption being 3 times higher that in 1990. (Source: National Centre for Sustainable and Development Greece, 2009)
Total Energy Intensity • Total primary energy consumption in Greece grew by 13.4% over the period 2000-2007, at an average annual rate of 1.7 % (NCSD, 2009). • Gross Domestic Product (GDP) in constant prices 2000-2007 grew by 33.6% at an average annual rate of 4.2 %. • Total energy intensity in Greece fell by 15.1% over the period 2000-2007, at an average annual rate of -2.2%. • Improvements in energy efficiency • Structural changes within the economy
EU Legislation That was the most far-reaching reform ever of European energy policy Directive 2002/91/EC on the Energy Performance of Buildings (EPBD) Directive 2006/32/EC on the Energy-use efficiency and Energy services Directive COM/2008/0780/ final – COD 2008/0223 Directive 2010/31/EU on the energy performance of buildings (recast) • Minimum energy efficiency requirements • Certifications – Inspections • Zero net energy buildings • Creation of an public, example building in every authority
Greek Legislation • Those two set a framework of: • Regular inspection requirements in heating, cooling, air conditioning and lighting systems • Inspections are compulsory for new constructions and existing buildings over 1000m2 that undergo major renovations, and existing buildings with floor area of at least 50 m2 when they are sold, rented or transferred to other relatives of the owners. Law3661/2008– “Measures for the reduction of energy consumption in buildings” . Regulation on the Energy Assessment of Buildings—KENAK
Expectations at the lodging sector • Expectations by WTO and WTTC: • International tourist arrivals in developing countries a rise ~8% per year in the period 1992–96 to a total of 182.6 million. • Economic development 29.9% of the global total (WTO, 1998). • A rise from 9.2% in 2010 to 9.6% by 2020 is expected means real GDP growth average 4.4%/year (“WTTC-Progress and priority report”, 2010). • Employment rise from 8.1% in 2010, to 9.2% of total employment by 2020. 2009 and 2010 have been depressed years for touristical activity, so a to boost is expected.
Energy building stock model Top-down approach Bottom-up approach Real data Energy audits’ data Hypothetical Building STRATEGIC PLAN for energy and environmental performance
Building's energy planning top-down and bottom-up approach A simple comparison between those models can lead to very different results. Bottom-up Top-down Jacobsen, 1998
Data base: Hotel’s buildings stock top-down approach • Data base of 55 hotels all over Greece • It was created with the use of questionnaires and audits based on the implementation of EPBD in Greek legislation. • Gathered information about: • Hotel operation • Building’s identity and envelope • Energy systems • Energy and water consumption • Average monthly occupancy levels in the auditing years • Indoor environmental quality • Interventions that was made during its operation or are planned
Data base • 1% 1-star hotels • 20% 2 -star hotels • 22% 3 -star hotels • 25% 4 -star hotels • 24% 5 -star & LUX hotels The collected data are mainly from Northern Greece
Data base • Building’s age • 55 % <1980 • 30% 1981 – 2000 • 15% >2001 • But they were all renovated after 2000
Data base Heated surface • Electricity consumption • Rural hotels up to 300 kWh/m2 • Urban hotels up to 400 kWh/m2
Data base • Energy consumption in a rural hotel
Real data • Characteristics of the Greek hotel sector: • Existing hotel stock according to arrival data for the last five years shows that the available hotel stock exceed 184.7% of current demand (ITEP, 2010). • Hotels represent 0.6% of the Greek building stock (712,052 m2) , but consume 10% of the total primary energy consumption of the building sector (CRES, 2009). • There are over 9,554 hotels over 700.000 rooms in operation, with 726.546 beds (EOT, 2010) with an average size of 76 beds per unit. • 65.8% are classical hotels, 45.9% are 2-star hotels, 56.0% operates seasonally, 68.2% is constructed after 1979.
Real Data: Greek hotel sector features Room facilities Hotel facilities
Real Data: Complement of the Hellenic touristical sector Energy demand peak (Source: ESYE, 2007)
Real data: C climatic zone • Is the second coldest zone in Greece • It includes two of the most popular destinations in Greece, Chalkidiki and Pieria. • 16.56% of the total hotel building stock is located here. • 56% have annual operation and 44 seasonal. • 38,4% are 2-star hotels.
Real data: C climatic zone Star distribution
Barriers for the promotion of energy conservation measures • The reasons for failing in the implementation of measures lies within: • The lack of information • Technical reasons • Financial reason • Personnel training • Legislative reason
Conclusions • The hotel sector is of vital importance for the Greek economy, so its energy performance for the building sector. • In the current study a snapshot of the Greek hotel industry. • The basic aim was to gather energy data of hotels and to recognise the importance of an energy audit in order to label it. • Audit procedures are of great importance. They should be carried out in a detailed level in order to determine the potential for energy savings. • Collecting data of the facility, evaluating and judging properly, leads to better and more cost-efficient ways of conserving energy. • The lack of validated and verified data on the energy performance and behavior of hotel’s building stock leads to the necessity of statistical processes. • Bottom-up and top-down approach can help in producing a strategy plan for the improvement of the hotel’s energy and environmental performance.