
GP と CAIN の比較
GP と CAIN の比較. GP データを CAIN のデータに変換. GP のデータには、 Energy(- は e-, + は e+ を意味する ), beta_x, beta_y, beta_z, x, y, z があり、 Px = absP×beta_x / beta Py = absP×beta_y / beta Pz = absP×beta_z / beta absP=sqrt(Energy^2 – Me^2), Me=0.5MeV beta = sqrt(beta_x^2 + meta_y^2 + beta_z^2) とし、位置は原点とした。.

GP と CAIN の比較
E N D
Presentation Transcript
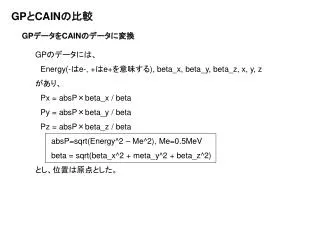
GPとCAINの比較 GPデータをCAINのデータに変換 GPのデータには、 Energy(-はe-, +はe+を意味する), beta_x, beta_y, beta_z, x, y, z があり、 Px = absP×beta_x / beta Py = absP×beta_y / beta Pz = absP×beta_z / beta absP=sqrt(Energy^2 – Me^2), Me=0.5MeV beta = sqrt(beta_x^2 + meta_y^2 + beta_z^2) とし、位置は原点とした。
Enegy distribution CAIN GP GPの方がCAINよりも広がっているようにも見えるが… Px distribution CAIN GP
Geometryの変更 Z=450cmにOptional Detectorを入れてある。Z=405~430cmにあるCH2MASKとZ=430~450cmにある BCALを取り除く。 No BCAL No CH2MASK 本来はBeam PipeがCH2MASKの前でR=5.0~16.2cmまで覆う。 本来の14mrad IR
Result of GP and CAIN data Andrei optimization CAINとGPの間で違いが見られない。
Anti-DID fieldの確認 QmagnetのところからIPに向けてe-(e+)を打って、IPに置いたOptional Detectorで運動の方向を確認する。


![Fundamental Five [Sean Cain, Mike Laird]](https://cdn3.slideserve.com/6085028/slide1-dt.jpg)