Download
1 / 16
160 likes | 295 Views
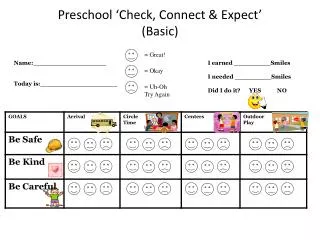
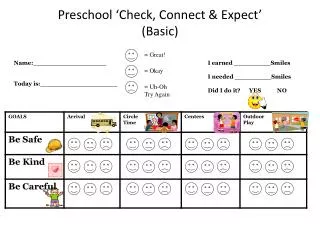
CLHS Check and Connect. Jamie Nord Check and Connect Administrator January 2010. Problem Identification/Analysis. Identified a need for a Tier II behavioral intervention at CLHS High number of 9th and 10th grade students with high failure rates

E N D
CLHS Check and Connect Jamie Nord Check and Connect Administrator January 2010
Problem Identification/Analysis • Identified a need for a Tier II behavioral intervention at CLHS • High number of 9th and 10th grade students with high failure rates • Tier I Universal supports in place through advisement • Still small group of students who needed something else; failing multiple classes; detachment from school
Problem Identification/Analysis Created a chart to organize data on at-risk students: GPA, MS Report (i.e., contract, check-ins), CORE Report, Discipline Referrals, HS Report, Problem Solving/SPED Eval, U of M Student Engagement Survey SAT team met to select final participants Need to be students reinforced by adult attention
Plan Development • Gathered information about two different programs: • Check and Connect out of the U of M • Behavior Education Program • Determined what fit with the need we were identifying • Combined aspects of each program to create CLHS Check and Connect
Student Selection Process • Student selection is determined using several data sources • GPA, MS Report, CORE Report, Discipline Referrals, Problem Solving/SPED Eval, • Counselors meet to select final participants • Counselors meet with perspective student for participation interest • Need to be students reinforced by adult attention
Student Selection Continued • Interested students meet with counselor and coordinator • Student receives agreement • Student expectations discussed • Students specific needs discussed from: • Student perspective • Parent perspective • Counselor perspective
Program Implementation – Morning Check In • Morning Check-In • Student meets with C & C Coordinator each morning before 1st block • Student arrival is verified • Ensure student has supplies for day; check planner • Check student’s mindset/attitude for the day • Send student off to class with positives • Student specific issues discussed
Program Implementation – Lunch Mentoring • Individual Problem Solving Sessions • Meet over student’s lunch period weekly or bi-weekly • Students are provided with a free lunch • Discussion centers around areas of concern identified by coordinator on data collection sheet • Work through problem solving process: • SODA (Situation, Options, Disadvantages, Advantages, Solution)
Program Implementation – Reward /Incentives • Reward System • Weekly drawing for check-ins • Rewards for attendance • Random rewards (i.e., Go Wild!) • Student activity passes ( i.e, sporting events, dances) • Larger rewards for making progress toward term end goals (i.e. a la carte lunch tickets, lunch brought in from local restaurants; computer time)
Program Implementation – Progress Monitoring • Student progress is tracked through the following: • Grades • Attendance • Discipline referrals • Problem Solving follow up • HS Credit achievements (Course Requirements)
Progress Monitoring ExampleNumber of Failed Classes Per Term Sample Student (Began Term 3)
Progress Monitoring ExampleNumber of Referrals Per Term Sample Student (Began Term 3)
Progress Monitoring ExampleNumber of Tardies Per Term Sample Student (Began Term 3)
Progress Monitoring ExampleNumber of Unexcused Absences Per Term Sample Student (Began Term 3)
Progress Monitoring ExampleNumber of Excused Absences Per Term Sample Student (Began Term 3)
Summary of C & C Data • Success of Check and Connect is measured by reviewing the following per student • Decreased failure rates – Increased academic success • Lower number of referrals • Decreased attendance issues • Increased engagement with academics and school environment