Download
1 / 4
40 likes | 141 Views
Analysis of reprocessed data for E(0) focusing on HBr ionization channels, KER spectra, predictions, and comparisons with REMPI spectra data for various J' values. Trends resembling ion intensity ratios and linewidths are observed.

E N D
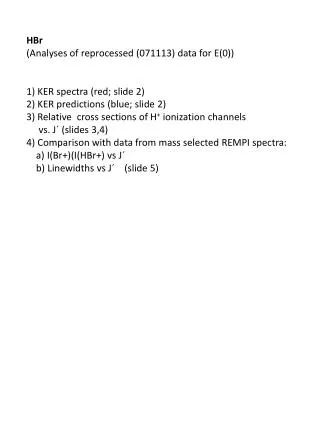
HBr (Analyses of reprocessed(071113) data for E(0)) 1) KER spectra (red; slide 2) 2) KER predictions (blue; slide 2) 3) Relative crosssections of H+ionizationchannelsvs. J´ (slides 3,4) 4) Comparisonwithdatafrommassselected REMPI spectra: a) I(Br+)(I(HBr+) vs J´ b) Linewidthsvs J´ (slide 5)
HBr: Fromreprocessed (071113) data for E(0): I(H+ + Br(1/2)) I(H+ + Br(3/2)) J´ Agust,labtop,C:/…/E0-KER-131107b.pxp (Gr1, Lay0 (<= Agust, Labtop, C:,…./XLS-131107aka.xlsx
HBr: Fromreprocessed (071113) data for E(0): I(H+ <- HBr+)a I(H+ + Br(3/2)) a: for KER region 1.0-2.5 eV J´ Agust,labtop,C:/…/E0-KER-131107b.pxp (Gr2, Lay1 (<= Agust, Labtop, C:,…./XLS-131107aka.xlsx
NB: Trendsresembleobservations for a) Ion-intensityratios and b) linewidthsderivedfrommassresolved REMPI spectra: a) b) https://notendur.hi.is/~agust/rannsoknir/papers/jcp138-044308-13.pdf