Download
1 / 12
120 likes | 257 Views
Using HLRmon for advanced visualization of resource usage. Enrico Fattibene INFN - CNAF ISCG 2010 – Taipei March 11 th , 2010. Outline. Motivation of work The classic HLRmon portal Specific WLCG portal Types of accounting data Web structure Conclusion. Motivation of work.

E N D
Using HLRmon for advanced visualization of resource usage Enrico Fattibene INFN - CNAF ISCG 2010 – Taipei March 11th, 2010
Outline • Motivation of work • The classic HLRmon portal • Specific WLCG portal • Types of accounting data • Web structure • Conclusion
Motivation of work • Grid resource usage is interesting for different kinds of users • Monitoring the Grid exploitation by user communities is a challenge due to the distributed nature of the system • Different users can be interested in different levels of accounting data aggregation • An exausthive graphycal interface is fundamental to analyse accounting information
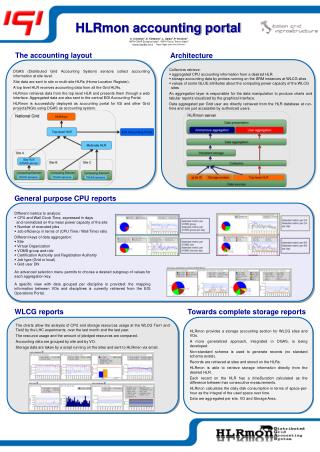
HLRmon • Accounting portal developed at INFN https://dgas.cnaf.infn.it/ • 2 portals • Classic portal • CPU accounting data from DGAS (Distributed Grid Accounting System) • WLCG portal • CPU and Storage accounting data • Customized for INFN Tier1 and Tier2 and LHC VO
Classic portal • CPU accounting data aggregated by fields not covered by privacy • Public section, visible by everyone • Different sets of charts • CPU and Wall Clock Time, expressed in time (days) and normalized on the mean power capacity of the site (KiloSpecInt2000) • Number of executed jobs • Job efficiency in terms of (CPU Time / Wall Time) ratio • Different keys of data aggregation • Site • Virtual Organization • VOMS role • Certification Authority • Job type (Grid or local) • CPU accounting data aggregated by user • Restricted access section, visible only by registered and authorized users
WLGC portal • One year ago INFN Grid managers expressed the need of a simple way to: • Analyse usage of CPU and Storage resources at the INFN Tier1 and Tier2 by the LHC experiments • Visualize accounting data grouped by site and by VO • Compare the resource usage with amount of overall pledged resources • Know the job efficiency level at the different sites • To this aim a customized version of HLRmon portal was developed
CPU accounting views • Available metrics: • CPU and Wall Clock Time, expressed in days and normalized by the mean power capacity computed with different benchmark types (KiloSpecInt2000 and HepSpec-06) • Number of executed jobs • Job efficiency in terms of (CPU Time / Wall Time) ratio • Usage levels are graphically compared with the amount of WLCG resources installed in each site, as declared by Grid managers and with the overall capacity of the site as published in the gLite information system • Possibility to compare LHC and no-LHC VOs usage • Possibility to compare Grid and local jobs • Last month and last year statistics are plotted
CPU graphs example Site name identifying the charts box Chart title explaining the metrics plotted Legend showing the sum of the metric computed on the period Amount of WLCG resources as declared by Grid managers Overall capacity as published in the gLite Information System
Storage accounting views • The Storage space used by LHC experiments is compared with the total available space, for each site • For each LHC VO and for each Storage Area, the Storage space used is shown • Data taken by a simple script running daily on the sites • Last month and last year statistics are plotted
Storage graphs example 1/2 Total space at the INFN-LNL Tier2 ALICE and CMS total space ALICE and CMS used space Total free space available in the site
Storage graphs example 2/2 ATLAS storage areas at INFN-T1
Conclusion • The HLRmon WLCG portal is able to show both CPU and storage accounting information • The portal compares Grid usage with installed resources • It integrates information from the gLite Information System with the accounting data • It is customizable for a desired set of Grid sites (using DGAS accounting service) and VOs