Download
1 / 16
160 likes | 181 Views
Explore how CLASlite and NDFI are used to monitor forest degradation in Peru, Cameroon, and Bolivia, leveraging Landsat imagery for precise analysis and mapping. Learn about the methodologies and successful results achieved in these regions.

E N D
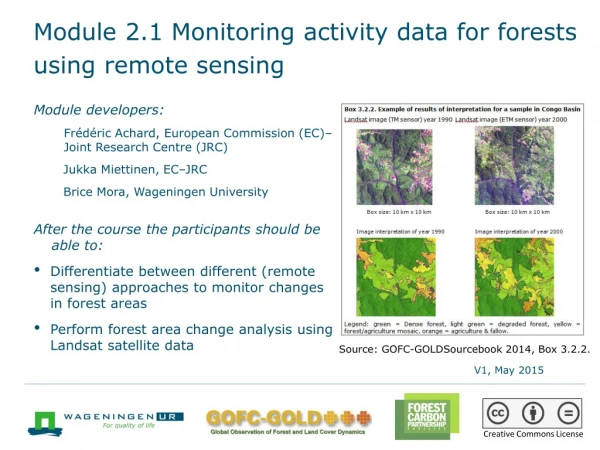
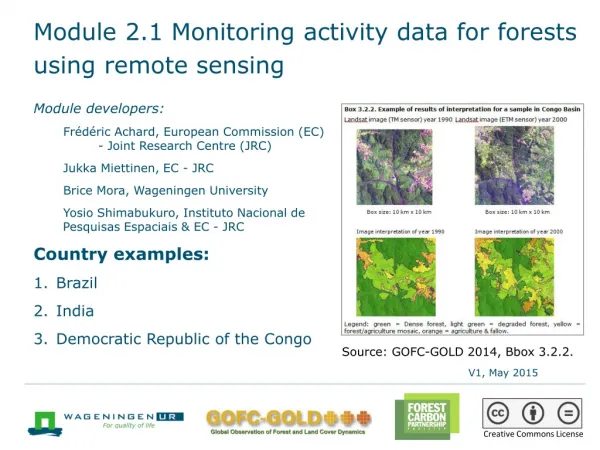
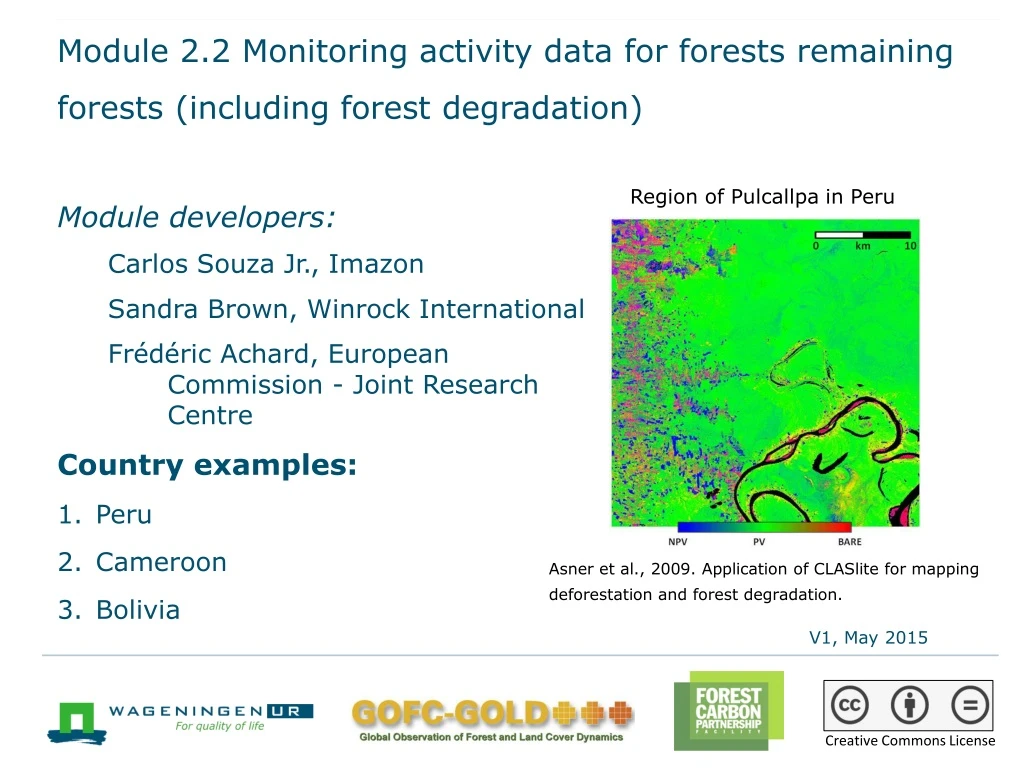
Module 2.2 Monitoring activity data for forests remaining forests (including forest degradation) Region of Pulcallpa in Peru Module developers: Carlos Souza Jr., Imazon Sandra Brown, Winrock International Frédéric Achard, European Commission - Joint Research Centre Country examples: • Peru • Cameroon • Bolivia Asner et al., 2009. Application of CLASlite for mapping deforestation and forest degradation. V1, May 2015 Creative Commons License
Introduction to Country Examples • The examples of this module illustrate how forest degradation has been mapped in three countries: Peru, Cameroon, and Bolivia. • Up to now, there has been no operational forest monitoring of forest degradation besides Brazil’s official system (DEGRAD from INPE) and an independent system from Imazon. • The applications covered in this tutorial are based on scientific studies; these results hold promise to scaling up operational forest-monitoring programs of forest degradation. • The examples focus on Landsat-like sensors.
1. Peru: Monitoring forest degradation using CLASlite • CLASlite is an automated system developed by Carnegie Institute for Science for: • calibration, preprocessing, atmospheric correction, cloud masking, Monte Carlo Spectral Mixture Analysis, and expert classification • CLASlite is capable of detecting deforestation and forest degradation, and was initially applied in Brazil and quickly expanded across Latin America, Africa, Asia. and other regions. • In 2009, the Minister of Environment of Peru (MINAM) through DGOT division, started a capacity-building program on remote sensing to support their zoning and planning program. • CLASlite was used extensively to monitor deforestation and forest degradation. • Peruvian forest change statistics became openly accessible to the general public through this program.
Forest degradation results using CLASlite Deforestation in Peru 2009–2010 2010–2011 CLASlite map generated from satellite imagery in the Peruvian Amazon While deforestation statistics had been published through MINAM DGOT for Peru, forest degradation results are still under evaluation Source: http://claslite.carnegiescience.edu/en/success-stories/peru-national-monitoring.html
2. Cameroon: Monitoring forest degradation using NDFI • Located in the Congo Basin, Cameroon holds a large area of tropical evergreen forests. • Forest degradation associated with fires and selective logging are one of the major threats to Cameroon’s forests. • Most of the logging activities in Cameroon happens in concessions. • Forest degradation associated with selective logging has been successfully detected and mapped in the southeast region of the Republic of Cameroon using NDFI (Normalized Differencing Fraction Index). Source: WRI, 2009. Cameroon Forest Land Allocation
Forest degradation test site • Orthorectified Landsat 7 ETM+ (path/row: 184/058) for 2002, 2004, 2005, 2006 2007, 2008 and 2009 were used. • The image processing procedures included: • Atmospheric correction • Spectral Mixture Analysis • Calculation of NDFI • Image classification • See lecture materials for more detail on these methods Source: Montellano and Armijo 2011.
Detection of forest degradation using NDFI image NDFI image Degraded forest Logging area Canopy damage in a logging area Source: Montellano and Armijo 2011, fig. 4a and fig. 4b.
Cameroon: Forest degradation example Log landings (in red) andcanopy damage (in white) GIS ancillary layer: roads (in black) Source: Montellano and Armijo 2011, fig. 6c and fig. 6d.
3. Bolivia: Monitoring forest degradation using a combination of SMA fractions and NDFI • Forest degradation associated with selective logging and forest fires were mapped in Bolivia using a combination of SMA fractions and NDFI. • Landsat images from 2003 to 2009 were used. • The study site is located at Mabet Forest Concession located at the Pando district, Bolivia, covering almost 50 thousand hectares. • The image processing protocol followed the methodology proposed by Souza et al. (2013). Study site in Bolivia at the Pando district
SMA fractions Landsat 5,4,3 Green Vegetation • Landsat RGB (5,4,3) showing no evidence of selective logging activity. • SMA fractions revealed better the location of roads and log landings (soil) and associated canopy damage (NPV fraction). NPV Soil Subset of the Landsat image acquired in 2010
Hybrid approach to estimate canopy damage A hybrid approach was used, combining the detection of • logging infrasctruture (i.e., roads and log landings), • textural analysis, • buffer spatial analysis (radius = 120 meters), and • polygon region aggregation (500 meters) to estimate areas of forest canopy damage Combining logging landings detection and spatial analysis to estimate canopy damage areas
Temporal analysis of NDFI images • Temporal analysis of NDFI images showing detection of forest degradation and forest canopy regeneration • Detection of logging impacts lasts no more than one year
Conclusions • SMA and NDFI were useful to detect logging infrastructure in the forest concession areas. • Annual time-series of Landsat imagery is necessary to assess whether concession sites are being harvested or not. • Introducing textural and spatial analysis (buffer and spatial aggregation) allows to estimate forest canopy damage areas associated with selective logging.
Recommended modules as follow-up • Module 2.3 for methods to assess emission factors in order to calculate changes in forest carbon stocks • Modules 3.1 to 3.3 to learn more about REDD+ assessment and reporting
References • Asner, Gregory P., David E. Knapp, AravindhBalaji, and GuayanaPáez-Acosta. 2009. Automated mapping of tropical deforestation and forest degradation: CLASlite. Journal of Applied Remote Sensing 3: 033543. • Butler, Rhett. 2013. “Peru Opens Deforestation Data to the Public, Shows Drop in Amazon Forest Clearing.” Mongabay.com, June 13. http://news.mongabay.com/2013/0613-peru-deforestation-tracking-system.html • Ministerio del Ambiente de Perú. 2011. Programa Nacional de Conservación de Bosques para la Mitigación del Cambio Climático: Ministerio de Agricultura de Perú. Lima: Dirección General Forestal y Fauna Silvestre. • Montellano, A. R., and E. Armijo. 2011. “Detecting Forest Degradation Patterns in Southeast Cameroon.” Paper presented at InstitutoNacional de PesquisasEspaciais, “Anais XV SimpósioBrasileiro de SensoriamentoRemoto,” Curitiba, PR, Brasil, 30 de abril a 05 de maio. http://www.dsr.inpe.br/sbsr2011/files/p0558.pdf • REDD Desk, “REDD in Cameroon,” n.d., http://theredddesk.org/countries/Cameroon.
Souza Jr., C. M., D. Roberts, and M. A. Cochrane, M. A. 2005. “Combining Spectral and Spatial Information to Map Canopy Damages from Selective Logging and Forest Fires.” Remote Sensing of Environment 98: 329-343. • Souza, C.M. Jr., Siqueira, J., Sales, M.H., Fonseca, A.V., Ribeiro, J.G., Numata, I., Cochrane, M.A., Barber, C.P., Roberts, D.A. and Barlow, J., 2013. “Ten-Year Landsat Classification of Deforestation and Forest Degradation in the Brazilian Amazon.” Remote Sensing 5 (11): 5493–5513. doi: 10.3390/rs5115493. • WRI, 2009. Cameroon Forest Land Allocation. http://www.wri.org/resources/maps/cameroon-forest-land-allocation-2009