Progress in Maths – Year 7 Assessment Comparison
70 likes | 91 Views
Compare your pre and post learning assessments using dual bar charts to track your progress in various math topics throughout the year.

Progress in Maths – Year 7 Assessment Comparison
E N D
Presentation Transcript
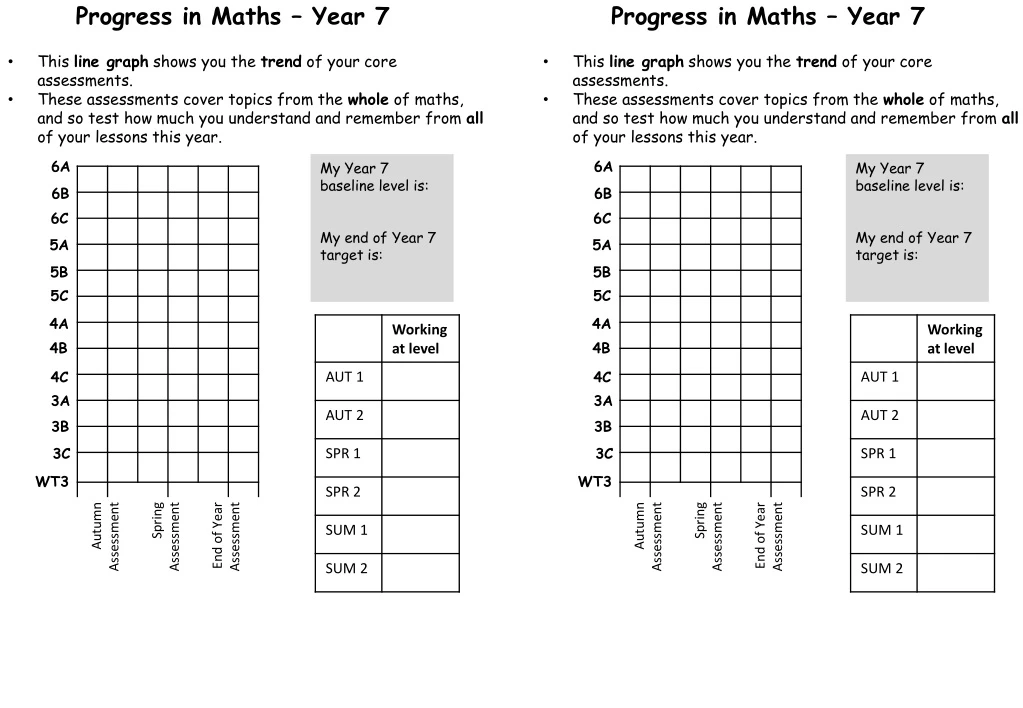
Progress in Maths – Year 7 Progress in Maths – Year 7 • This line graph shows you the trend of your core assessments. • These assessments cover topics from the whole of maths, and so test how much you understand and remember from all of your lessons this year. • This line graph shows you the trend of your core assessments. • These assessments cover topics from the whole of maths, and so test how much you understand and remember from all of your lessons this year. 6A 6A My Year 7 baseline level is: My end of Year 7 target is: My Year 7 baseline level is: My end of Year 7 target is: 6B 6B 6C 6C 5A 5A 5B 5B 5C 5C 4A 4A 4B 4B 4C 4C 3A 3A 3B 3B 3C 3C WT3 WT3
Progress in Maths – Year 8 Progress in Maths – Year 8 • This line graph shows you the trend of your core assessments. • These assessments cover topics from the whole of maths, and so test how much you understand and remember from all of your lessons this year. • This line graph shows you the trend of your core assessments. • These assessments cover topics from the whole of maths, and so test how much you understand and remember from all of your lessons this year. 7A 7A My Year 8 baseline level is: My end of Year 8 target is: My Year 8 baseline level is: My end of Year 8 target is: 7B 7B 7C 7C 6A 6A 6B 6B 6C 6C 5A 5A 5B 5B 5C 5C 4A 4A 4B 4B 4C 4C 3A 3A 3B 3B 3C 3C
This dual bar chart allows you to compare your percentage scores from your pre learning assessment and your post learning assessment for each topic you have done this year. The difference will be the amount of progress you made in that area. 100 95 90 85 Commendation 80 75 70 65 Pass 60 55 50 % Score 45 40 35 30 25 20 15 10 5 0 Year 7 Maths Mastery Modules
This dual bar chart allows you to compare your percentage scores from your pre learning assessment and your post learning assessment for each topic you have done this year. The difference will be the amount of progress you made in that area. 100 95 90 85 Commendation 80 80 75 70 65 Pass 60 60 55 50 % Score 45 40 35 30 25 20 15 10 5 0 Year 8 Maths Mastery Modules
Year 7 Progress Chart: Line Graph Template 8C 7A 7B 7C 6A 6B 6C 5A 5B 5C 4A 4B My Year 7 baseline level is: My end of Year 7 target is: 4C 3A 3B 3C WT3
Year 7 Assessment Record: Comparative Bar Chart Template 100 95 90 85 80 75 70 65 60 55 50 % Score 45 40 35 30 25 20 15 10 5 0
Year 7 Assessment: Bar Chart Template 100 95 90 85 80 75 70 65 60 55 50 % Score 45 40 35 30 25 20 15 10 5 0