Chapter 12: Inventory Control
Chapter 12: Inventory Control. Purposes of Inventory. 1. To maintain independence of operations 2. To meet variation in product demand 3. To allow flexibility in production scheduling 4. To provide a safeguard for variation in raw material delivery time

Chapter 12: Inventory Control
E N D
Presentation Transcript
Purposes of Inventory 1. To maintain independence of operations 2. To meet variation in product demand 3. To allow flexibility in production scheduling 4. To provide a safeguard for variation in raw material delivery time 5. To take advantage of economic purchase-order size
Inventory Costs • Holding (or carrying) costs • Costs for capital, storage, handling, “shrinkage,” insurance, etc • Setup (or production change) costs • Costs for arranging specific equipment setups, etc • Ordering costs • Costs of someone placing an order, etc • Shortage costs • Costs of canceling an order, etc
Independent vs. Dependent Demand Independent Demand (Demand for the final end-product or demand not related to other items) Dependent Demand (Derived demand items for component parts, subassemblies, raw materials, etc) Finished product E(1) Component parts
Inventory Systems • Single-Period Inventory Model • One time purchasing decision (Example: vendor selling t-shirts at a football game) • Seeks to balance the costs of inventory overstock and under stock • Multi-Period Inventory Models • Fixed-Order Quantity Models • Event triggered (Example: running out of stock) • Fixed-Time Period Models • Time triggered (Example: Monthly sales call by sales representative)
Wetsuit example • The “too much/too little problem”: • Order too much and inventory is left over at the end of the season • Order too little and sales are lost. • Example: Selling Wetsuits • Economics: • Each suit sells for p = $180 • Seller charges c = $110 per suit • Discounted suits sell for v = $90
“Too much” and “too little” costs • Co = overage cost (i.e. order “one too many” --- demand < order amount) • The cost of ordering one more unit than what you would have ordered had you known demand – if you have left over inventory the increase in profit you would have enjoyed had you ordered one fewer unit. • For the example Co = Cost – Salvage value = c – v = 110 – 90 = 20 • Cu = underage cost (i.e. order “one too few” – demand > order amount) • The cost of ordering one fewer unit than what you would have ordered had you known demand – if you had lost sales (i.e., you under ordered), Cu is the increase in profit you would have enjoyed had you ordered one more unit. • For the example Cu = Price – Cost = p – c = 180 – 110 = 70
Newsvendor expected profit maximizing order quantity • To maximize expected profit order Q units so that the expected loss on the Qth unit equals the expected gain on the Qth unit: • Rearrange terms in the above equation -> • The ratio Cu / (Co + Cu) is called the critical ratio (CR). • We shall assume demand is distributed as the normal distribution with mean m and standard deviation s • Find the Q that satisfies the above equality use NORMSINV(CR) with the critical ratio as the probability argument. • (Q-m)/s = z-score for the CR so • Q = m + z * s Note: where F(Q) = Probability Demand <= Q
Finding the example’s expected profit maximizing order quantity • Inputs: • Empirical distribution function table; p = 180; c = 110; v = 90; Cu = 180-110 = 70; Co = 110-90 =20 • Evaluate the critical ratio: • NORMSINV(.7778) = 0.765 • Other Inputs: mean = m = 3192; standard deviation = s = 1181 • Convert into an order quantity • Q = m + z * s • = 3192 + 0.765 * 1181 • 4095 Find an order quantity Q such that there is a 77.78% prob that demand is Q or lower.
Single Period Model Example • A college basketball team is playing in a tournament game this weekend. Based on past experience they sell on average 2,400 tournament shirts with a standard deviation of 350. They make $10 on every shirt sold at the game, but lose $5 on every shirt not sold. How many shirts should be ordered for the game? Cu = $10 and Co= $5; P≤ $10 / ($10 + $5) = .667 Z.667 = .432 (use NORMSINV(.667) therefore we need 2,400 + .432(350) = 2,551 shirts
Hotel/Airline Overbooking The forecast for the number of customers that DO NOT SHOW UP at a hotel with 118 rooms is Normally Dist with mean of 10 and standard deviation of 5 Rooms sell for $159 per night The cost of denying a room to the customer with a confirmed reservation is $350 in ill-will and penalties. Let X be number of people who do not show up – X follows a probability distribution! How many rooms ( Y ) should be overbooked (sold in excess of capacity)? Newsvendor setup: Single decision when the number of no-shows in uncertain. Underage cost if X > Y (insufficient number of rooms overbooked). For example, overbook 10 rooms and 15 people do not show up – lose revenue on 5 rooms Overage cost if X < Y (too many rooms overbooked). Overbook 10 rooms and 5 do not show up; pay penalty on 5 rooms
Overbooking solution • Underage cost: • if X > Y then we could have sold X-Y more rooms… • … to be conservative, we could have sold those rooms at the low rate, Cu = rL = $159 • Overage cost: • if X < Y then we bumped Y - X customers … • … and incur an overage cost Co = $350 on each bumped customer. • Optimal overbooking level: • Critical ratio:
Optimal overbooking level • Suppose distribution of “no-shows” is normally distributed with a mean of 10 and standard deviation of 5 • Critical ratio is: • z = NORMSINV(.3124) = -0.4891 • Y = m + z s = 10 -.4891 * 5 = 7.6 • Overbook by 7.6 or 8 • Hotel should allow up to 118+8 reservations.
Multi-Period Models:Fixed-Order Quantity Model Model Assumptions (Part 1) Demand for the product is constant and uniform throughout the period Lead time (time from ordering to receipt) is constant Price per unit of product is constant Inventory holding cost is based on average inventory Ordering or setup costs are constant All demands for the product will be satisfied (No back orders are allowed)
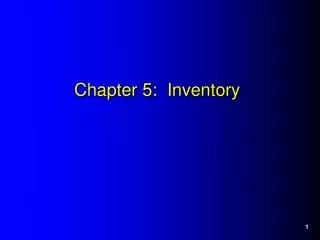
Basic Fixed-Order Quantity Model and Reorder Point Behavior 4.The cycle then repeats. 1. You receive an order quantity Q. Number of units on hand Q Q Q R L L 2. Your start using them up over time. 3. When you reach down to a level of inventory of R, you place your next Q sized order. Time R = Reorder point Q = Economic order quantity L = Lead time
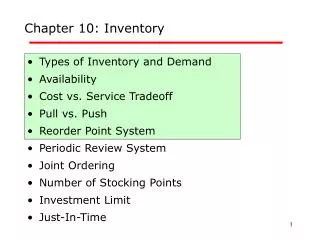
Cost Minimization Goal Total Cost Annual Cost of Items (DC) QOPT By adding the item, holding, and ordering costs together, we determine the total cost curve, which in turn is used to find the Qopt inventory order point that minimizes total costs C O S T Holding Costs Ordering Costs Order Quantity (Q)
Deriving the EOQ Using calculus, we take the first derivative of the total cost function with respect to Q, and set the derivative (slope) equal to zero, solving for the optimized (cost minimized) value of Qopt We also need a reorder point to tell us when to place an order
Basic Fixed-Order Quantity (EOQ) Model Formula TC=Total annual cost D =Demand C =Cost per unit Q =Order quantity S =Cost of placing an order or setup cost R =Reorder point L =Lead time H=Annual holding and storage cost per unit of inventory Total Annual = Cost Annual Purchase Cost Annual Ordering Cost Annual Holding Cost + +
EOQ Class Problem 1 Dickens Electronics stocks and sells a particular brand of PC. It costs the firm $450 each time it places and order with the manufacturer. The cost of carrying one PC in inventory for a year is $170. The store manager estimates that total annual demand for computers will be 1200 units with a constant demand rate throughout the year. Orders are received two days after placement from a local warehouse maintained by the manufacturer. The store policy is to never have stockouts. The store is open for business every day of the year. Determine the following: • Optimal order quantity per order. • Minimum total annual inventory costs (i.e. carrying plus ordering – ignore item costs). • The optimum number of orders per year (D/Q*)
EOQ Problem 2 The Western Jeans Company purchases denim from Cumberland textile Mills. The Western Jeans Company uses 35,000 yards of denim per year to make jeans. The cost of ordering denim from the Textile Mills is $500 per order. It costs Western $0.35 per yard annually to hold a yard of denim in inventory. Determine the following: a. Optimal order quantity per order. b. Minimum total annual inventory costs (i.e. carrying plus ordering). c. The optimum number of orders per year.
Problem 3 A store specializing in selling wrapping paper is analyzing their inventory system. Currently the demand for paper is 100 rolls per week, where the company operates 50 weeks per year.. Assume that demand is constant throughout the year. The company estimates it costs $20 to place an order and each roll of wrapping paper costs $5.00 and the company estimates the yearly cost of holding one roll of paper to be 50% of its cost. • If the company currently orders 200 rolls every other week (i.e., 25 times per year), what are its current holding and ordering costs (per year)?
Problem 3 • The company is considering implementing an EOQ model. If they do this, what would be the new order size (round-up to the next highest integer)? What is the new cost? How much money in ordering and holding costs would be saved each relative to their current procedure as specified in part a)? • The vendor says that if they order only twice per year (i.e., order 2500 rolls per order), they can save 10 cents on each roll of paper – i.e., each roll would now cost only $4.90. Should they take this deal (i.e., compare with part b’s answer) [Hint: For c]. calculate the item, holding, and ordering costs in your analysis.]
Cycle-service level = 85% Average demand during lead time R zL Safety Stocks Suppose that we assume orders occur at a fixed review period and that demand is probabilistic and we want a buffer stock to ensure that we don’t run out Probability of stockout (1.0 - 0.85 = 0.15)
Safety Stock Formula Reorder Point = Average demand + Safety stock Reorder Point = Demand during Lead Time + Safety Stock Demand during lead time = daily demand * L = d*L Safety stock = Zservice~level * sL Where sL = square root of L*s2, where s is the standard deviation of demand for one day
Problem 4 A large manufacturer of VCRs sells 700,000 VCRs per year. Each VCR costs $100 and each time the firm places an order for VCRs the ordering charge is $500. The accounting department has determined that the cost of carrying a VCR for one year is 40% of the VCR cost. If we assume 350 working days per year, a lead-time of 4 days, and a standard deviation of lead time of 20 per day, answer the following questions. • How many VCRs should the company order each time it places an order? • If the company seeks to achieve a 99% service level (i.e. a 1% chance of being out of stock during lead time), what will be the reorder point? How much lower will be the reorder point if the company only seeks a 90% service level?
Fixed-Time Period Model with Safety Stock Formula q = Average demand + Safety stock – Inventory currently on hand
Multi-Period Models: Fixed-Time Period Model: Determining the Value of sT+L • The standard deviation of a sequence of random events equals the square root of the sum of the variances
Example of the Fixed-Time Period Model Given the information below, how many units should be ordered? Average daily demand for a product is 20 units. The review period is 30 days, and lead time is 10 days. Management has set a policy of satisfying 96 percent of demand from items in stock. At the beginning of the review period there are 200 units in inventory. The daily demand standard deviation is 4 units.
Example of the Fixed-Time Period Model: Solution (Part 1) The value for “z” is found by using the Excel NORMSINV function.
ABC Classification System 60 % of $ Value A 30 B 0 C % of Use 30 60 • Items kept in inventory are not of equal importance in terms of: • dollars invested • profit potential • sales or usage volume • stock-out penalties So, identify inventory items based on percentage of total dollar value, where “A” items are roughly top 15 %, “B” items as next 35 %, and the lower 65% are the “C” items