
Impact of Cardiovascular Parameters on Heart Failure Prevalence: An Analytical Study
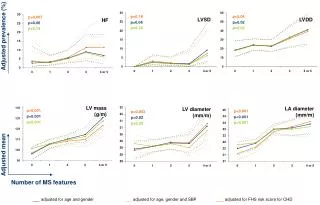
This study examines the adjusted prevalence of left ventricular systolic dysfunction (LVSD) and left ventricular diastolic dysfunction (LVDD) in relation to various cardiovascular and demographic factors. We analyze parameters including left ventricular mass, left atrial diameter, and left ventricular diameter, adjusting for age, gender, and systolic blood pressure. Significant associations are highlighted (p

Impact of Cardiovascular Parameters on Heart Failure Prevalence: An Analytical Study
E N D
Presentation Transcript
p=0.19 p=0.06 p=0.24 p=0.04 p=0.02 p=0.02 p=0.007 p=0.06 p=0.14 LVSD LVDD HF Adjusted prevalence (%) LV mass (g/m) LA diameter (mm/m) LV diameter (mm/m) p<0.001 p<0.001 p<0.001 p<0.001 p<0.001 p<0.001 p=0.003 p=0.02 p=0.25 Adjusted mean Number of MS features __adjusted for age and gender __ adjusted for age, gender and SBP __adjusted for FHS risk score for CHD