Download
1 / 30
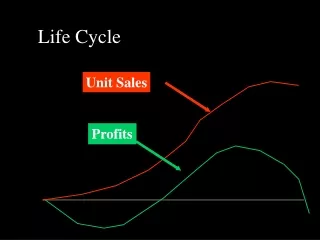
300 likes | 505 Views
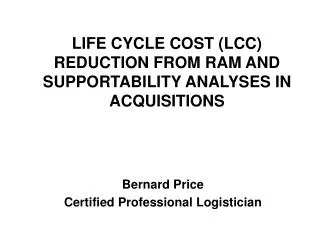
LIFE CYCLE COST (LCC) REDUCTION FROM RAM AND SUPPORTABILITY ANALYSES IN ACQUISITIONS. Bernard Price Certified Professional Logistician. Notional System LCC Overview. 100. LIFE CYCLE COST (LCC) DETERMINATION. 80. APPROX 90% OF LCC DETERMINED. 60. Cumulative Percent. 40. ACTUAL FUNDS

E N D
LIFE CYCLE COST (LCC) REDUCTION FROM RAM AND SUPPORTABILITY ANALYSES IN ACQUISITIONS Bernard Price Certified Professional Logistician
Notional System LCC Overview 100 LIFE CYCLE COST (LCC) DETERMINATION 80 APPROX 90% OF LCC DETERMINED 60 Cumulative Percent 40 ACTUAL FUNDS SPENT 20 APPROX 10% OF TOTAL COST Milestones C A B PRODUCTION OPERATION & SUPPORT
Total Ownership Cost Categories Identified Logistics Costs & Non-Logistics Costs Regardless of Fund Type “It’s all green” OPA RDTE MPA OMA • Cross Referenced to DA LCC Elements 1.09, 2.02, 2.05, 4.01, 5.01, 5.04...
Development Engineering Producibility Engineering & Planning Development Tooling Prototype Manufacturing Systems Engineering & Project Management System Test & Evaluation Data/Reports Development Facilities Software Development Non-Recurring Production Recurring Production Production Engineering Changes Other Development Costs Other Production Costs Military Construction Non-Logistics Cost Categories Non-Logistics Cost Categories(Potential Investment Cost Areas)
Operators Energy (POL & Batteries) Field Support Repair Labor Contractor Logistics Support Warranty Costs Scheduled Maintenance /Overhaul Initial Provisioning Replenishment Spares Inventory Holding Costs Support Equipment Test Program Sets System Specific Training Training Materials Post Production Software Support Technical Documentation Transportation Integrated Material Management Post Production Systems Engineering/Project Management System Hardware Changes Facilities/Sites Activation System Specific Base Operations Lease Operations & Maintenance Demilitarization/Disposal Industrial Readiness Logistics Cost Categories Logistics Cost Categories(Initial Costs - Red & Recurring Costs - Black)
Warranty Costs Level of Repair Analysis: Organic Repair Costs Contractor Logistics Support Costs Initial Provisioning of Spares & Repair Parts Replenishment of Spares & Repair Parts Inventory Holding Costs of Spares Transportation Costs for Forward & Retrograde Shipments Source of Repair Analysis: Support Equipment – Common & System Specific Test Program Sets Technical Documentation for Repairs Supportability Costs Impacted by RAM
Types of Analyses to Support Decisions • Best Value Analysis – Rates & Weights Multiple Factors to Evaluate the Benefits & Cost of Each Alternative (Source Selections & Pre-MS B) • Logistics Support Optimization Analyses –Lowest Net Present Value Total Cost among Support Alternatives to Achieve the Same Ao (Pre-MS C) • Economic Analysis - Evaluates the Return on Investment of an Alternative to Status Quo (After Design Frozen & Level of Repair Established)
Return on Investment (ROI) • ROI = Net Present Value Savings of Improvement / Net Investment Cost for Improvement • Net Present Value Savings from Recurring Cost Differences of Improvement vs. the Status Quo • Net Investment Costs covers Improvement Initial Costs less any Remaining Status Quo Initial Costs • Alternatives with the Highest ROI are typically worth funding the Improvement Investment Costs
Reasons for Estimating Life Cycle Costs (LCC) • Design Tradeoffs Yield LCC Differences that Aids Decision Making • Decisions Made Early Drive Future Supportability and Support Costs • Project Managed Acquisition Programs Require Cost Estimates for Financial Planning & Budgeting • Quantifying LCC Helps to Identify Drivers If RAM LCC impacts are measured, LCC can be managed and reduced
Army LCC Management Models to be Discussed • COMPASS*LOGSA Computerized Optimization Model for Predicting & Analyzing Support Structures • ACE IT*DASA(CE) Automated Cost Estimating Integrated Tools • LCET*CE LCMC Logistics Cost Estimating Tool (Includes Time Phased COMPASS) * TOOLS ARE LINKED FOR INTEGRATED LCC ESTIMATING
ACE IT Usefulness • Integrates Cost Estimates or Data From Other Computer Programs • Often Used for Program Office Estimates & LCC Estimates • Provides Credible Estimates for Time Phased Non-Logistics Acquisition Costs
LCET Model Usefulness • More Credible Logistics Costs in LCC Estimates • Time-Phased COMPASS Module Results Yield Highest Fidelity Support Cost Estimates • Relates Item Reliability to Readiness & Support Costs • Adjusts Results for Worth of Warranty • Logistics Cost Spreadsheet Module Covers • Macro-Level Logistics Costs w/o Item Level Reliability • Non-COMPASS Logistics Costs After Items Known • Merges Multiple Runs of Different Time Frames • Links COMPASS & ACE IT to Permit Concurrent Supportability Optimization & LCC Estimation
Logistics Costs Coverage Time Phased COMPASS Covers 10 of 25 Logistics Cost Categories With More Fidelity Than the Logistics Cost Spreadsheet Module
What Each Model in Integrated Tool Set Determines • COMPASS - Optimizes Viable Support Concepts to Ao • Least Cost Initial Provisioning • 2-Level vs. 3-Level Maintenance • Return LRU vs. SRU • Organic vs. Contractor • Repair vs. Throwaway • Time Phased COMPASS - Annual COMPASS Costs • LCET Spreadsheet - Adds in Other Logistics Costs • ACEIT – LCC Tool Adds in Non-Logistics Costs Optimizes Supportability & Computes LCC Concurrently
Improving Supportability Analysis & LCC Estimating Concurrently Logistics Cost Estimating Non-Logistics Cost Estimating Supportability Analysis ACEIT N/A Red Green* COMPASS N/A Green Yellow LCET Green N/A N/A Integrated/Linked Models Green* Green Green
Acquisition Policies Supported by Integrated Tools DoD Policies: • Perform Design & Supportability Tradeoffs to LCC • Perform Supportability Analysis Integral to Systems Engineering • Aid Performance Based Logistics Implementation for Product Support Army Policies: • Manage TOC Reduction • Evaluate TOC as a Factor in Source Selection • Makes Supportability Co-Equal to Cost, Schedule & Performance
Is “Outstanding” Product Support Worth $5M? Source Selection Example Offeror A Offeror B Product Support Past Performance Technical Contract Cost $25M $20M
Is “Outstanding” Product Support Worth $5M? Yes! Source Selection Example Offeror A Offeror B Product Support Past Performance Technical TOC $50M $60M
Easy For Bidders/Contractor Can Be Used Over Life Cycle Common Baseline Encourages Meeting Modeling Objectives Ease Of Evaluation Proven/Validated Technique Govt. Needs To Validate/Understand Prolongs Evaluations Lack Source Selection Common Baseline More Upfront Work for Bidder/Contractor Chance of Initial User Error Source Selection Modeling Alternatives Advantages Disadvantages Everybody Uses Their Own Model Use Govt. Selected Model
Provides a Common Evaluation Baseline among Bidders Expedites Evaluation by Government After Data or Analyses are Obtained Improves Government/Industry Teaming with Common Analyses Permits Contractor to Determine an Optimum Support Effectiveness/Logistics Chain Structure & LCC Baseline Permits Contractor to Evaluate the Impact of Proposed Changes to a LCC Baseline Reasons Contractors Should Use Integrated Tools in Acquisitions
Data Required to Analyze TOC • Appropriate Data is Needed to estimate Government & Contractor Responsible Costs • Data Depends on Proposed Contractor Support • When contractor fixes end items, only end item level data needed • When Govt fixes end items & Contractor fixes LRUs, need to know how often LRUs are removed and costs for LRU repair • When Govt fixes LRUs with SRUs, need to know how often LRUs & SRUs are removed and costs for their repair or replacement
When A Tailored Spreadsheet Is A Good Evaluation Alternative • Contractor Repaired End Item • Small Number of Known TOC Driver LRUs that are Contractor Repaired • Legacy End Item where Maintenance is Not a TOC Driver
Which Integrated Tool Combo to Use for TOC Evaluation • ACEIT & LCET - In Development Prior to Knowing LRUs • ACEIT, LCET & COMPASS – In Development or LRIP When LRUs Known & Government Repairs End Item • LCET & COMPASS – In Production or Re-Procurement If Maintenance is a TOC Driver
Source Selection Plan Evaluating Total Ownership Costs TECHNICAL PRAG TOC* COST/PRICE FACTORS CONTRACT COSTS/PRICES CONTRACTOR COSTS GOVT COSTS MANAGEMENT SUBFACTOR SUBFACTOR COST REALISM (if not Fixed Price) TOC REDUCTION PLAN DATA SHARING PLAN COST ADJUSTMENTS TECHNICAL INPUT RISK FACTORS COST INPUT RISK FACTORS * TOC EVALUATION RESULTS IN AN ESTIMATED AMOUNT OF DOLLARS
Costs that Tend to be Drivers in Many Systems Non-Logistics Costs: • Software Development • Recurring Production Cost Logistics Costs: • Post Deployment Software Support • Replenishment Spares • Contractor Logistics Support - or - Organic Repair
Logistics Cost Drivers that Tend to Vary by System • Systems with Platforms • Operators • System Specific Training • Energy – POL • Man-pack Equipment/ Some Sensors • Energy - Batteries • Low Reliability or High Operational Availability • Initial Provisioning • Inventory Holding Costs (Frequent Item Upgrades) • Long Term, Failure Free Warranties • Warranty Costs
Logistics Cost Drivers that Tend to Vary by System • Low Density, Highly Complex Equipment • System Engineering/Program Management • Integrated Material Management • High Density, Highly Complex Systems • System Specific Training • Training Material Development & Maintenance • Some Secure, Sensitive Systems • Facilities/Site Activations • System Specific Base Operations
Source Selection Plan Evaluating Total Ownership Cost Drivers TECHNICAL PRAG COST/PRICE FACTORS MANAGEMENT SUBFACTOR TOC DRIVER METRICS* CONTRACT COSTS/PRICES TOC REDUCTION PLAN DATA SHARING PLAN TECHNICAL INPUT RISK FACTORS COST INPUT RISK FACTORS COST REALISM (if not Fixed Price) * TOC EVALUATION RESULTS IN AN ADJECTIVAL RATING FOR QUANTITATIVE THRESHOLDS
How Current Acquisition Practices Can Improve • Analyze System Reliability and Operational Availability Requirements • Use Government Ao Driven LCC Models for Best Value Decisions & Plan to Encourage Industry to Use Them • Use TOC and/or Ao as an Evaluation Factor in Source Selection • Provide Incentives to Industry for TOC Reduction • Establish a Shared Data Environment
Influence of RAM and LCC Reduction on System Cost Effectiveness Probability System Performs Appropriately In Mission (A) Product Effectiveness Probability System Lasts Mission Without Failing (B) System Effectiveness Probability System is Available to Accomplish Mission (C) Support Effectiveness System Cost Effectiveness Design Product to Reduce Life Cycle Costs (Relates to A, B & C) Cost Effectiveness Support Effectiveness Optimization (Relates to B & C) Basically Contractor Responsibility Typically Government and Contractor Responsibility