Download
1 / 10
100 likes | 130 Views
Satellite product estimates tropopause folding regions & clear-air turbulence using infrared channel data, validated with pilot reports. Enhance aviation safety and forecasting with real-time insights.

E N D
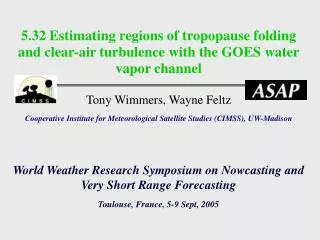
5.32 Estimating regions of tropopause folding and clear-air turbulence with the GOES water vapor channel Tony Wimmers, Wayne Feltz Cooperative Institute for Meteorological Satellite Studies (CIMSS), UW-Madison World Weather Research Symposium on Nowcasting and Very Short Range Forecasting Toulouse, France, 5-9 Sept, 2005
front CAT and tropopause folds Abstract: Clear-air turbulence remains a significant aviation hazard, yet by its nature it is very difficult to detect. One of the sources of clear-air turbulence is the dynamic instability associated with “tropopause folding”, which describes the entrainment of stratospheric air into tropospheric levels at upper-level fronts. We describe a near real-time satellite product that estimates areas of tropopause folding in regions of strong humidity gradients in the GOES midwave infrared (water vapor) channel. Using an empirical relationship between upper tropospheric humidity gradients and tropopause breaks, the algorithm estimates that turbulence-generating tropopause folds protrude from some of these tropopause breaks. This product is validated over the United States with manual pilot reports as well as newer automated aircraft reports of turbulence. Upper-air front 14 150 stratosphere 12 200 subtropical air mass 10 Pressure (hPa) 300 Height (km) 8 tropopause 400 6 500 600 4 polar air mass 700 (~100 km)
Building a statistical model stratosphere subtropical air mass surface tropopause polar air mass +15K -5K Upper-air front latitude longitude Vertical component of the fold
Web product: Real-time pirep validation • Pirep data is provided courtesy of NCAR Aviation Digital Data Service (ADDS)
Web product: Real-time TAMDAR validation • TAMDAR (Tropospheric Airborne Meteorological Data Report) is part of the Great Lakes Field Experiment • Unfortunately, it is mostly lower and midtroposphere
Web pages: http://cimss.ssec.wisc.edu/asap/exper/tfoldsVer2/pirepSep.html http://cimss.ssec.wisc.edu/asap/exper/tfoldsVer2/tamdarDisplay.html
Validation: Details • April 8-30, 2005 1500-2300 UTC (peak time) • Eastern U.S. (away from mountain wave turbulence) • Above 15,000 feet (mid- and upper troposphere) • Areas of strong convection are filtered out (no C.A.T.) • If the pirep is in a modeled fold and reports turbulence, then this is a correctly classified “Yes” report. If the pirep is outside a modeled fold and reports no turbulence, this is a correctly classified “No” report. • 2,293 pirep observations, 62% of ALL observations are turbulent.
Validation: Method • Find the model’s “Probability of Detection” for turbulence • Next, search for any further constraints on the model that improve the Probability of Detection
Statistics for tropopause fold turbulence prediction (N=2293, “background” rate of success=0.64) * Does not purport to classify all negative reports
Preliminary conclusions: Trop folding + CAT • The tropopause folding model shows significant skill at predicting upper-tropospheric turbulence • The model increases in accuracy significantly as it is made more selective (Prob of Detection = 82%) • Predicted turbulence is predominantly “light” or “moderate” stratosphere subtropical air mass polar air mass Upper-air front