Download
1 / 9
90 likes | 267 Views
End-user engagement for improved projections of local sea-level change and tropical cyclone activity. Greg Berman (Woods Hole Sea Grant & Cape Cod Cooperative Extension) November 18, 2013. Climate Change Adaptation Initiative. Short Answer: We’re not done yet….

E N D
End-user engagement for improved projections of local sea-level change and tropical cyclone activity Greg Berman (Woods Hole Sea Grant & Cape Cod Cooperative Extension) November 18, 2013 Climate Change Adaptation Initiative
Short Answer: We’re not done yet… Climate Change Adaptation Initiative
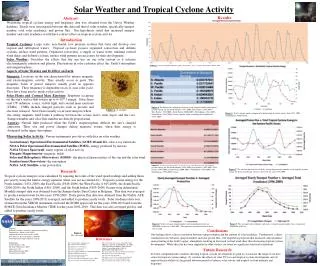
We’re not done yet… Improving NOAA’s Climate Services for the Coastal Zone: A Special Competition ADVANCED REGIONAL AND DECADAL PREDICTIONS OF COASTAL INUNDATION FOR THE U.S. ATLANTIC AND GULF COASTS Benjamin Horton, Jeffrey Donnelly, Reide Corbett, Andrew Kemp, Ken Lindeman, Michael Mann, Dick Peltier, Stefan Rahmstorf SLR & Storms
NOAA Project Hurricane tracks (≥Cat 2 intensity) from the Emanuel (2006) model passing within 100 km of the Woods Hole (17,354 total storms). Cat 2 storms (green), 242 Cat 3 storms (yellow) , 4 Cat 4 storms (red). Natural compaction and subsidence (e.g., LA) Post glacial rebound effects (e.g., US NE) Gravity effect of ice (e.g., Global) Glacial isostatic adjustment and sea-level change. State of the art report. Pippa Whitehouse, Durham University. April 2009
The Need Assist in developing reciprocal relationships between resource users/ managers and technical info producers in order to facilitate end-user engagement and informed tools for users/ managers of those resources.
The Need Workshops Assist in developing reciprocal relationships between resource users/ managers and technical info producers in order to facilitate end-user engagement and informed tools for users/ managers of those resources. GIS-based geospatial archives, outreach graphics, web-based data visualization schemes and tutorials
Workshop Support identify key info needs of end-users 3 workshops on U. S. eastern seaboard (summer of 2012) Theme of Sea Level Rise Science and Planning Needs -What spatial and temporal scientific information do you need to advance inundation planning in your position? -How do you prefer this information to be provided (format and medium)? -How can the science be scaled up to have a larger impact across multiple disciplines or regions?
Workshop Results Temporal scale: Due to the political realities of their positions, local planners see little direct application for 100 yr time scales: 4 yr, 10 yr, 30 yr are the scales that matter. Spatial Scale: Local, fine scale spatial products (“my property”). “As fine a resolution as possible” was mentioned with much frequency. Watershed and regional scale products also. Format & medium of product: Inundation maps under varying scenarios (with DEM and shape files) were desired. Not surprisingly, almost every possible format within every medium was desired. This included web-available products, smartphone apps, twitter feeds, etc. We attempted to clarify that we would produce what time and project resources allowed. Scaling up Concerns focused on:- Tipping points: when are thresholds crossed, Education (case studies mentioned multiple times), Cross-disciplinary partnerships, Economic cost/ benefit analysis, Ecosystem services (before and after etc): biological and watershed impacts, wetland mitigation, Transportation impacts Multiple Scales and Ranges: Many do not recommend worst case scenarios for storm events. Historic , “Best Case”, and “Worst Case” …Note that even “Best Case” is not that great!
Progress GIS-based geospatial archives, outreach graphics, web-based data visualization schemes and tutorials Workshops