Download
1 / 18
190 likes | 418 Views
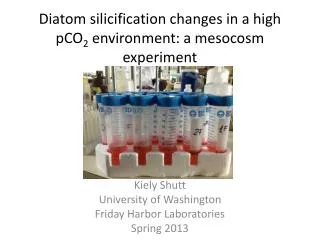
Diatom silicification changes in a high pCO 2 environment: a mesocosm experiment . Kiely Shutt University of Washington Friday Harbor Laboratories Spring 2013. Diatoms: A Brief Overview. Major primary producers Most common phytoplankton Single celled, some are chain forming

E N D
Diatom silicification changes in a high pCO2 environment: a mesocosm experiment Kiely Shutt University of Washington Friday Harbor Laboratories Spring 2013
Diatoms: A Brief Overview • Major primary producers • Most common phytoplankton • Single celled, some are chain forming • Primary controllers of silica cycling in the ocean • Radial or bilateral symmetry • Diatoms have a silica requirement in order to build frustules
Silicification Biogenic Silica SiO2 Uptake Dissolved H4SiO4
Methods Biogenic Silica Filtering Rapid filter method by Paasche (1980) Prepped and ran on spectrometer using Strickland and Parsons (1968) Biogenic Silica/Diatom Cell Calculation Biogenic Silica Liter ( ) Phytoplankton Cells # Diatoms # Cells Liter
Research Questions • Does biogenic silica differ between pCO2 treatments? • What stressors affected biogenic silica and silica per diatom cell? • Micronutrient limitation? (Iron, Zinc) • Macronutrient limitation? (Nitrate, Silicate) • Microzooplankton grazing pressure? • Light limitation?
Biogenic silica through time F(2,32)= 5.250, p=0.072
Nitrate and biogenic silica through time Statistically strong negative correlations for all treatment groups: ρ= -.923, -.913, -.884
Biogenic silica and dissolved silicate through time Statistically strong negative correlations for all treatment groups: ρ= -.939, -.897, -.854
Grazing pressure Previous studies found increase in diatom silicification under grazing pressure (Pondaven et al 2007) In order to show a significant association between silicification and grazing, our ρ value would need to be closer to -1 or 1.
PAR (Eiensteins m-2 d-1) Adapted from (Martin-jézéquel et al 2000)
Picomole Silica Per Cell Through Time F(2,30)= 4.200, p=0.122
Research Questions - Revisited • Does biogenic silica differ between pCO2 treatments? Nope! • What stressors affected biogenic silica and silica per diatom cell? • Micronutrient limitation? (Iron, Zinc) • Macronutrient limitation? (Nitrate, Silicate) • Grazing pressure? • Light limitation? Could be!
Conclusions • No significant differences between pCO2 treatments for biogenic silica or silicification in diatoms • Macronutrient limitation and grazing pressure were not affecting silicification in diatoms • Light limitation likely to be the reason why we see the trends in silicification data as well as other unmeasured variables within our mesocosm system
Acknowledgements • Jim Murray • Robin Kodner • Kelsey Gaessner • Evelyn Lessard • Mike Foy • Barbara Paul • Amanda Fay • Molly Roberts • Kitae Park • Peers: Phil Gravinese, Kelly Govenar, Jen Apple, Andrew Turner, Daneil Newcomb, NatsukoPorcino, Amy Stephens • University of Washington - Friday Harbor Labs • Mary Gates Endowment • Henry and Holly Wednt Endowment • Educational Foundation of America • Herbs Tavern