Performing Regression Analysis Using Raster Data
Performing Regression Analysis Using Raster Data. Kevin M. Johnston Xuguang Wang. Outline. Linear regression Budworm impact Spatial autocorrelation Sampling Using the coefficients Spatial regression Logistics regression Species distributions and climate change.

Performing Regression Analysis Using Raster Data
E N D
Presentation Transcript
Performing Regression Analysis Using Raster Data Kevin M. Johnston Xuguang Wang
Outline • Linear regression • Budworm impact • Spatial autocorrelation • Sampling • Using the coefficients • Spatial regression • Logistics regression • Species distributions and climate change : Performing Regression Analysis Using Raster Data
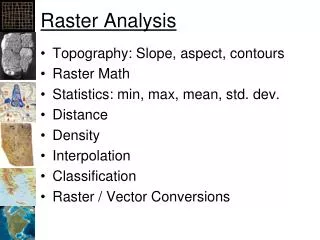
Problem 1: Linear regression • Field data (raster surface) of percent canopy damage caused by spruce bud worm (an insect) • Assumption: where the insect has caused greater damage there are more favorable features located there • Know what features the insect is responding to but too complex to quantify the relationship • Want to predict other areas where the spruce budworm may attack : Performing Regression Analysis Using Raster Data
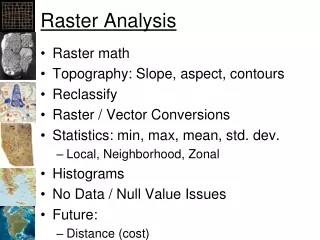
Regression analysis in GIS • Establishes the relationship of many features and values • Presents the relationship in a concise manner • The analysis output is conducive to the GIS • Make assumptions from samples and apply to the entire population (every location in the raster) : Performing Regression Analysis Using Raster Data
Character of regression • Dependent variable • Biomass • Tree growth • Probability of deer • Independent variable • Slope • Soils • Vegetative type • Linear regression (methods, stepwise, etc) • Continuous data • Logistic regression • Presence or absence : Performing Regression Analysis Using Raster Data
Spatial autocorrelation • What is it? • The effects on the output from the regression analysis • Testing for spatial autocorrelation • Spatial correlation indices • Sample points • Correlation (take every 5 cell out of 6 row) • Random sampling • In the statistical algorithm • Spatial Regression : Performing Regression Analysis Using Raster Data
Using a statistical package • Synergy between a statistical package and Spatial Analyst • Why do we need the statistical package? • Basic assumption–independent observations : Performing Regression Analysis Using Raster Data
Creating the preference surface • Run regression with the significant factors • Obtain the coefficients for each value within each raster • Use the coefficients in a Map Algebra expression to create a preference surface • The coefficients identify positive or negative influence and magnitude Z = a0 + x1a1 + x2a2 + x3a3 … xnan : Performing Regression Analysis Using Raster Data
Creating the preference surface • Output from a regression • Creating the prediction surface with Map Algebra Coef# Coef ------------------------------------- 0 1.250 1 -0.029 2 0.263 Outgrid = 1.25 + (-0.029* elevation) + (0.263 * distancetoroads) : Performing Regression Analysis Using Raster Data
Spatial Regression • Still must determine significant variables • Spatial regression uses spatial autocorrelation • Use the results to create a probability surface • Where the regression capability exist: • Classical statistical packages • SAS, SPSS, R • ArcGIS Spatial Statistics toolbox • Ordinary Least Squares • Geographically Weighted Regression : Performing Regression Analysis Using Raster Data
Demo 1: Regression analysis Linear Spatial autocorrelation
Problem 2: Logistics regression – True absence • Want to examine the potential affects of climate change on the distribution of animal species • Know the current distributions of the species (the dependent variable) • We have a series of independent variables: • Vegetation type (as dummy variables) • Elevation, slope, and aspect • Distance from roads and cities • Etc. : Performing Regression Analysis Using Raster Data
Logistics regression • Presence/absence model • Create a probability surface Z = 1 / 1 + exp (- S ai xi) : Performing Regression Analysis Using Raster Data
Logistics regression • Steps • Determine sample points • Run the logistic regression in R (4 scenarios) • Alter input independent variables (All – average temp) (min/max) • Greater than 90% and 95% confidence • Identify top two models based on statistics • Create probability and distribution surfaces • Spatial evaluation • Identify best model • Run model on • 2029, 2059, and 2099 : Performing Regression Analysis Using Raster Data
Sample Points : Performing Regression Analysis Using Raster Data
Logistics regression: Dependent variables • Pygmy rabbit • Red tree vole • Rocky mountain elk • Sage grouse • Silver bat • Spotted owl • Townsend bat • White vole • American marten • Big horn sheep • Desert rat • Dusky wood rat • Fisher • Flying squirrel • Gray wolf • Prong horn sheep
Logistics regression: Independent variables • Aspect • Elevation • Slope • Euclidean distance from population • Density of streams • Density of roads • Average yearly temperature • Average maximum temperature • Average minimum temperature • Average precipitation : Performing Regression Analysis Using Raster Data
Logistics regression: Independent variables (cont.) • Vegetation – Subtropical mixed forest • Vegetation – Temperate grassland • Vegetation – Temperate shrub land • Vegetation – Temperate evergreen needle-leaf woodland • Vegetation – Temperate warm mixed forest • Vegetation – Temperate evergreen needle-leaf forest • Vegetation – Maritime evergreen needle-leaf forest • Vegetation – Subalpine forest • Vegetation - Tundra : Performing Regression Analysis Using Raster Data
The climate data From Ron Nielson’s group at Oregon State University/ US Forest Service • We have two climate change models • Hadley (from the UK) • MIROC 3.2 (from Japan) • Each model has two scenarios • The moderate, mid-level “A1B” carbon scenario • The higher, more extreme “A2” carbon scenario • There are three time periods • “e”: Early-century, or 2020-2024 averaged • “m”: Mid-century, or 2050-2054 averaged • “l”: Late-century, or 2095-2099 averaged : Performing Regression Analysis Using Raster Data
Spatial Regression • Still must determine significant variables • Spatial regression uses spatial autocorrelation • Use the results to create a probability surface • Where the regression capability exist: • Classical statistical packages • SAS, SPSS, R • ArcGIS Spatial Statistics toolbox • Ordinary Least Squares • Geographically Weighted Regression : Performing Regression Analysis Using Raster Data
Logistics regression • Steps • Determine sample points • Run the logistic regression in R (4 scenarios) • Alter input independent variables (All – average temp) (min/max) • Greater than 90% and 95% confidence • Identify top two models based on statistics • Create probability and distribution surfaces • Spatial evaluation • Identify best model • Run model on • 2029, 2059, and 2099 : Performing Regression Analysis Using Raster Data
Logistics Diagnostics Table : Performing Regression Analysis Using Raster Data
Logistic Statistics Table : Performing Regression Analysis Using Raster Data
Logistics regression • Steps • Determine sample points • Run the logistic regression in R (4 scenarios) • Alter input independent variables (All – average temp) (min/max) • Greater than 90% and 95% confidence • Identify top two models based on statistics • Create probability and distribution surfaces • Spatial evaluation • Identify best model • Run model on • 2029, 2059, and 2099 : Performing Regression Analysis Using Raster Data
Map Algebra Statement – Probability Surface outraster = 1 / (1 + Exp(-1 * (-9.10434320922079 + (0.00024204847633 * Raster(aspectdata)) + (-0.00023299740223 * Raster(demdata)) + (0.02496203077777 * Raster(slopedata)) + (-0.00001843603003 * Raster(eucpopareasdata)) + (0.01792043302346 * Raster(roaddendata)) + (-0.02570716609559 * Raster(streamsdendata)) + (-0.11777663211510 * Raster(tempmaxdata)) + (-0.51013740745761 * Raster(tempmindata)) + (0.00819861349118 * Raster(precpptdata)) + (15.77179850521890 * Raster(veg22data)) + (8.35312593006918 * Raster(veg17data)) + (9.79381294103217 * Raster(veg16data)) + (10.78427995755950 * Raster(veg12data)) + (15.93611773165130 * Raster(veg11data)) + (11.20574409634300 * Raster(veg8data)) + (11.96869401781200 * Raster(veg7data)) + (12.62821578657110 * Raster(veg6data)) + (10.51739997038930 * Raster(veg2data))))) : Performing Regression Analysis Using Raster Data
Probability Surface : Performing Regression Analysis Using Raster Data
Actual Distribution : Performing Regression Analysis Using Raster Data
Prediction Surface Current .5 : Performing Regression Analysis Using Raster Data
Logistics regression • Steps • Determine sample points • Run the logistic regression in R (4 scenarios) • Alter input independent variables (All – average temp) (min/max) • Greater than 90% and 95% confidence • Identify top two models based on statistics • Create probability and distribution surfaces • Spatial evaluation • Identify best model • Run model on • 2029, 2059, and 2099 : Performing Regression Analysis Using Raster Data
Spatial evaluation • Evaluation • If species is there and predict it is there (100) • If the species is not there and predict it is not there (100) • Adjustments false positives and false negatives • Adjust based on how far the misprediction is • Adjust if Maxent also predicted the species is there or not • Adjust if historically the species was present : Performing Regression Analysis Using Raster Data
Spatial evaluation outPow = Int(((Power((Abs(Raster(distance1) - 132537) + 0), 4) - minValue1) / (maxValue1 - minValue1)) * ((25 - 1) + 1)) : Performing Regression Analysis Using Raster Data
Logistics regression • Steps • Determine sample points • Run the logistic regression in R (4 scenarios) • Alter input independent variables (All – average temp) (min/max) • Greater than 90% and 95% confidence • Identify top two models based on statistics • Create probability and distribution surfaces • Spatial evaluation • Identify best model • Run model on • 2029, 2059, and 2099 : Performing Regression Analysis Using Raster Data
Demo 2: Regression analysis Logistics regression Climate change analysis
Summary • Linear regression • Magnitude • Logistics regression • Presence/absence • Spatial regression • Sample, calculate coefficients, and create surface • Statistical capability • Spatial Statistics Toolbox • ArcGIS to R; SAS Bridge : Performing Regression Analysis Using Raster Data
Thank you… Please fill out the session survey: First Offering ID: 340/1732 Online – www.esri.com/ucsessionsurveys Paper – pick up and put in drop box : Performing Regression Analysis Using Raster Data