Download
1 / 28
280 likes | 524 Views
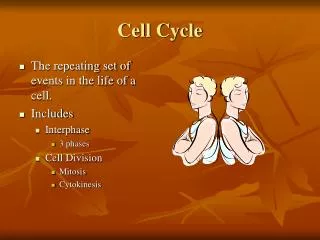
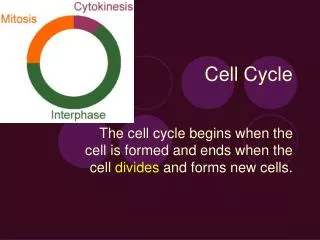
Modelling of Cell Cycle. Budding yeast biology. The cell cycle is the succession of events whereby a cell grows and divides into two daughter cells that each contain the information and machinery necessary to repeat the process.

E N D
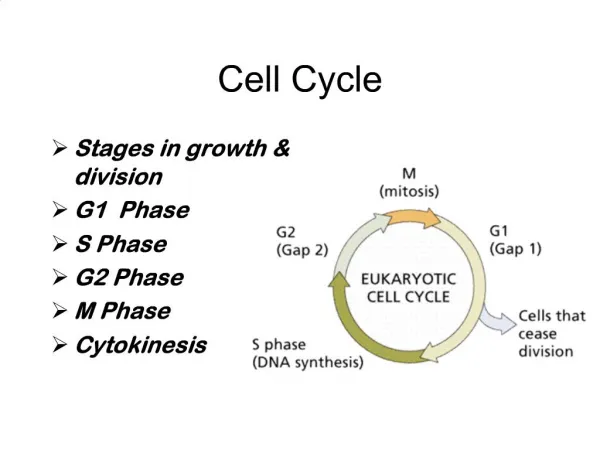
Budding yeast biology The cell cycle is the succession of events whereby a cell grows and divides intotwo daughter cells that each contain the information and machinery necessary to repeat the process. Between one cell division and the next, all essential components of the cell must be duplicated. The most important component is the genetic material (DNA molecules present in chromosomes),which must be accurately replicated and the two copiescarefully segregated to the two daughter cells. The processes of DNA replication and sister chromatid separation occur in temporally distinct phases of theeukaryotic cell cycle. These are known as S-phase (DNA synthesis) and M-phase (mitosis), In general, S and M phases separated by two gaps, known as G1 and G2.
Budding yeast biology • The unicellular budding yeast, Saccharomyces cerevisiae, is a model system to study cell cycle regulation. • As a yeast cell progresses through the cell cycle, it halts at two major checkpoints: • the G1 checkpoint: If DNA damage is detected, mating pheromone is present, or the cell has not reached the critical size, the cell arrests in G1 and is unable to undergo the Start transition which commits the cell to a new round of DNA synthesis and mitosis. • the spindle assembly checkpoint: If DNA damage is detected, DNA is not replicated completely, or chromosomes are not aligned on the metaphase plate, the cell arrests in metaphase and is unable to undergo the Finish transition, whereby sister chromatids are separated and the cell divides.
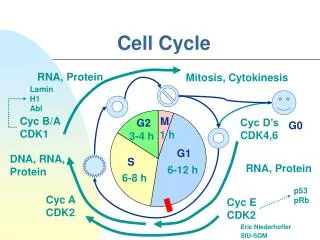
Cell cycle Passage through the eukaryotic cell cycle is strictly regulated by -the periodic synthesis and destruction of cyclins -that bind and activate cyclin-dependent kinases (CDKs). The notion kinase expresses that their function is phosphorylation of proteins with controlling functions. -Cyclin-dependent kinase inhibitors (CKI) also play important roles in cell cycle control by coordinating internal and external signals and impeding proliferation at several key checkpoints.
Checkpoints • They ensure that all processes connected with • cell cycle progression, • DNA doubling and • separation • occur correctly. • At checkpoints, the cell cycle • can be aborted or arrested • They involve checks • on completion of S phase, • on DNA damage, and • on failure of spindle behavior. • If the damage is irreparable, apoptosis is triggered.
Checkpoints • These checkpoints are enforced by the Cdk/cyclin complexes, a family of protein kinases. • The catalytic subunit of these complexes, the cyclin-dependent kinase (Cdk), is only active when combined with a regulatory cyclin subunit. • In budding yeast, there is only one Cdk (called Cdc28); and nine different cyclins (Cln1-3, Clb1-6). Depending on the cyclin partner, Cdc28/cyclin dimers accomplish specific and different tasks. Proper progression through the cell cycle requires the successive activation and inactivation of these Cdc28/cyclin dimers. • There are several different mechanisms for regulating Cdc28 activity in the cell, namely: • through the synthesis of cyclins by various transcription factors (SBF, MBF and Mcm1). • through the degradation of cyclins (promoted by Cdc20/APC, Cdh1/APC, and Grr1/SCF). • through association with stoichiometric CDK inhibitors (Sic1 and Cdc6, and Far1). • through phosphorylation and dephosphorylation of Cdc28 by Swe1 and Mih1.
Minimal Model One of the first genes to be identified as being an important regulator of the cell cycle in yeast was cdc2/cdc28(Nurse and Bissett, 1981), where cdc2 refers to fission yeast and cdc28 to budding yeast. Activation of the cdc2/cdc28 kinase requires association with a regulatory subunit referred to as a cyclin. A minimal model for the mitotic oscillator involving a cyclin and the Cdc2 kinase has been presented by Goldbeter (Goldbeter, 1991). It covers the cascade of post-translational modifications that modulate the activity of Cdc2 kinase during cell cycle. In the first cycle of the bicyclic cascade model, the cyclin promotes the activation of the Cdc2 kinase by reversible dephosphorylation, and in the second cycle, the Cdc2 kinase activates a cyclin protease by reversible phosphorylation. The model was used to test the hypothesis that cell cycle oscillations may arise from a negative feedback loop, i.e. the cyclin activates the Cdc2 kinase while the Cdc2 kinase triggers the degradation of the cyclin.
Minimal cascade model • Only two main actors:cyclin and cyclin dependent kinase. • Cyclin- synthesized at constant rate,vi, • - triggers the transformation of inactive (M+) into • active (M) Cdc2 kinase by enhancing the rate of a phosphatase,v1. • A kinase with ratev2reverts this modification. • Cdc2 kinase- phosphorylates a protease (v3) shifting it from the inactive (X+) to the active (X) form. • The activation of the cyclin protease is reverted by a further phosphatase with rate v4. vi vd A Cyclin v1 M+ M v2 v3 X+ X v4 C- cyclin concentration; M and X- fractional concentrations of active cdc2 kinase and active cyclin protease, 1-M, 1-X - fractions of inactive kinase and phosphatase Km values - Michaelis constants. and - effective maximal rates Differential equations for the changes of M and X are modeled with the so-called Goldbeter-Koshland switch
Model application vi vd A Cyclin This model involves only Michaelis-Menten type kinetics, but no form of positive cooperativity. It can be used to test whether oscillations can arise solely as a result of the negative feedback provided by the cdc2-induced cyclin degradation and of the threshold and time delay involved in the cascade. The time delay is implemented by considering post-translational modifications (phosphorylation/dephosphorylation cycles v1/v2 and v3/ v4). v1 M+ M v2 v3 X+ X v4
vi vd A Model behavior Cyclin v1 M+ M v2 v3 X+ X v4 Cdc2 kinase, M For certain parameters: threshold in the dependence of steady state values for M on C and for X on M. Cyclin, C
vi vd A Model behavior Cyclin v1 M+ M v2 B v3 X+ X v4 Cdc2 kinase, M Provided that this threshold exists, the evolution of the bicyclic cascade proceeds in a periodic manner. Starting from low initial cyclin concentration, this value accumulates at constant rate, while M and X stay low. As soon as C crosses the activation threshold, M rises. If M crosses the threshold, X starts to increase sharply. X in turn accelerates cyclin degradation and consequently, C, M, and X drop rapidly. The resulting oscillations are of the limit cycle type. Cyclin, C C C Concentraions M X Time/min
vi vd C A Cyclin C v1 Concentraions M+ M v2 M X v3 X+ X v4 Time/min B D Cdc2 kinase, M Cdc2 kinase, M Cyclin, C Cyclin, C
Yeast Cell Cycle Start G1 S Budding Cell division Cln2 Clb5 SBF MBF Sic1Clb5 Sic1P Sic1 Sic1Clb2 Clb2 Hct1 Ccd20 Ccd20 Hct1 APC APC M metaphase M anaphase Finish Progression through cell cycle Activation Active protein or complex Production, degradation, complex formation Inhibition Inactive protein or complex
Basic mechanism To understand the basic logic of the cell cycle, to a first approximation, the groups of Tyson and Novak, and, independently, Kim Nasmyth have envisioned that the cell cycle in budding yeast is an alternation between two self-maintaining stable steady states (G1 and S/G2/M). The Start transition carries a cell from G1 to S/G2/M, and the Finish transition from M back to G1 (Nasmyth, 1996, Tyson et al., 1995, Tyson et al., 2001). The two self-maintaining steady states arise primarily from the mutual antagonism between B-type cyclins (Clb1-6, in association with Cdc28) and the G1 stabilizers (Cdh1, Sic1 and Cdc6). Cdh1/APC degrades the Clbs, whereas Sic1 and Cdc6, referred to together as the CKIs, stoichiometrically inhibit Cdc28/Clb complexes. Clb-kinases, on the other hand, can inactivate Cdh1 and destabilize CKIs. Since Clb-kinases and the G1 stabilizers mutually inhibit each other, these two classes of proteins cannot coexist. In the G1 state, Clb-kinase activities are low because Clb synthesis processes are turned OFF, their degradation by APC/Cdh1 is ON, and their inhibitors, the CKIs, are abundant. The reverse is true in the S/G2/M phase.
Transition between states The transitions between these two alternative steady states (G1 and S/G2/M) requires helper molecules (detailed in Chen et al., 2000).
Start transition The Start transition is facilitated by Cln-kinases (Cln1-3/Cdc28 complexes) that can phosphorylate and inactivate CKI and Cdh1, but are not themselves opposed by CKI and Cdh1. This transition is driven by cell growth. When the small daughter cell has grown to a critical size and Cln-kinase activities have reached a critical level, CKI and Cdh1 are inactivated, Clb-kinase activities increase, a bud emerges, DNA replication commences and spindle pole is duplicated. The mother cell executes Start soon after birth because it has already attained the critical size. The rising activity of Clb-kinases turns off Cln synthesis, causing Cln-kinase activities to drop in preparation for the Finish transition.
Finish transition The Finish transition is facilitated by Cdc20, which is activated indirectly by Clb-kinases. When the spindle assembly checkpoint is lifted (DNA synthesis is complete and chromosomes are aligned on the metaphase plate), - Cdc20 is activated, - sister chromatids are separated, and - Clbs are partially degraded. Cdc20 also initiates the activation of the phosphatase Cdc14, which reverses the inhibitory effects of Clb-kinases on Cdh1 and CKIs, allowing the latter two to overpower the Clb-kinases and extinguish their activities. As Clb-kinase activities drop after Finish, Cdc20 activity also disappears, preparing the cell for the subsequent Start transition.
Major improvements of the model: The previous model of the budding yeast by Chen et al., 2000 gives an adequate description of the Start transition, but, since it was published, many more molecular details about the Finish transition have come to light. Also in that paper, Clb2-kinase was assumed to activate Cdc20 directly, making the checkpoint protein Mad2 essential for cell viability, which is contrary to observation. Here we introduce an intermediary enzyme, IE, that provides a time delay between Clb2 activation and Cdc20 activation, such that Mad2 is no longer an essential protein. The new model also accounts for how the MEN pathway facilitates Cdc14 release from the RENT complex and how the spindle assembly checkpoint impinge on the cell cycle engine.
Simulations • Simulations compared well with • experimental observations. • For a culture growing exponentially at a MDT=90 min, • (1) Duration of cell cycle phases: • Cycle time, minG1 length, minS/G2/M, min • Daughter Cell • 97.5 (101.2)*42 (36)57 (64) • Mother Cell • 81 (80)22 (28)59 (52) • Data for a wild type yeast diploid strain A364A D5 are • obtained from Brewer et al., 1984, simulation results are • shown in parenthesis. • (2) The relative amounts of cyclins and CKIs: ([Cln1]+[Cln2]) : (Clb5]+[Clb6]) : ([Clb1]+[Clb2]) : [Sic1] : [Cdc6]=15 : 3.8 : 7.5 : 1 : 3 (in experiments)=15 : 3.3 : 4.7 : 2.8 : 3.7 (in model). • Measurements are made by Cross et al., 2002, and Archambault et al., 2003.
Yeast Cell Cycle – Model Regulatory interactions of 20 genes of S.cerevisiae. The full arcs represent activatory regulation, the dashed arcs represent inhibitory regulation. The relationship between genes regulating one common gene is described by ‘OR’-function.