Understanding Ellipses: Geometric and Algebraic Definition Basics
This guide provides a concise introduction to ellipses, highlighting their geometric and algebraic definitions. An ellipse is formed when a plane intersects a cone obliquely. Algebraically, it is defined as the set of points where the sum of the distances to two fixed points, called foci, is constant. The process of identifying and plotting ellipses is also detailed with examples, including finding centers, major and minor axes, and foci. Key terminology, such as major and minor axes, is explained to enhance understanding of ellipse properties and equations.

Understanding Ellipses: Geometric and Algebraic Definition Basics
E N D
Presentation Transcript
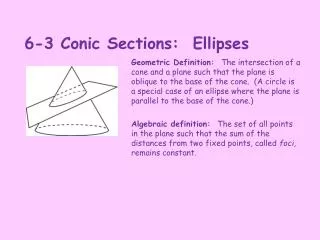
6-3 Conic Sections: Ellipses Geometric Definition: The intersection of a cone and a plane such that the plane is oblique to the base of the cone. (A circle is a special case of an ellipse where the plane is parallel to the base of the cone.) Algebraic definition: The set of all points in the plane such that the sum of the distances from two fixed points, called foci, remains constant.
So, about those foci . . . From each point in the plane, the sum of the distances to the foci is a constant. Example: B A d1 d2 d1 d2 x f1 f2 Point A: d1+d2 = c foci Point B: d1+d2 = c y
Ellipse Terminology (0,a) Major axis Minor axis (0,b) (0,c) f1 Center Major axis (c,0) (c,0) Minor axis x x vertex (a,0) (b,0) (b,0) (a,0) f2 foci f1 Center vertex foci f2 (0,c) (0, b) y (0, a) y + + + +
Example 1: + Step 1: Identify if the ellipse is horizontal (a2 with x-term) or vertical (a2 with y-term). This ellipse is horizontal since 16 larger term and with x-term. Step 2: Identify and plot the center (h,k). This ellipse has a center at (0,0). Step 3: Plot the endpoints of the major axis. The major axis is horizontal so plot |a| units left and right from center. Since a2=16, a=4; therefore plot 4 units left and right of center. Step 4: Plot the endpoints of the minor axis. The minor axis is vertical so plot |b| units above and below the center. Since b2=9, b=3; therefore plot 3 units above and below center. Step 5: Calculate and plot foci. b2=a2 - c2 9 = 16 - c2; c2=7; c = 2.65. Since foci are on major axis (horizontal in this case), plot 2.65 units left and right of center. Step 6: Connect endpoint of axes with smooth curve.
Example 2: + Step 1: Identify if the ellipse is horizontal (a2 with x-term) or vertical (a2 with y-term). This ellipse is vertical since 81 larger term and with y-term. Step 2: Identify and plot the center (h,k). This ellipse has a center at (0,0). Step 3: Plot the endpoints of the major axis. The major axis is vertical so plot |a| units above and below center. Since a2=81, a=9; therefore plot 9 units above and below center. Step 4: Plot the endpoints of the minor axis. The minor axis is horizontal so plot |b| units left and right from the center. Since b2=36; b=6; therefore plot 6 units left and right of center. Step 5: Calculate and plot foci. b2=a2 - c2 36= 81 - c2; c2=45; c = 6.7. Since foci are on major axis (vertical in this case), plot 6.7 units above and below the center. Step 6: Connect endpoint of axes with smooth curve.
Example 3: + Step 1: Identify if the ellipse is horizontal (a2 with x-term) or vertical (a2 with y-term). This ellipse is horizontal since 25 larger term and with x-term. Step 2: Identify and plot the center (h,k). This ellipse has a center at (5,4). Step 3: Plot the endpoints of the major axis. The major axis is horizontal so plot |a| units left and right from center. Since a2=25, a=5; therefore plot 5 units left and right of center. Step 4: Plot the endpoints of the minor axis. The minor axis is vertical so plot |b| units above and below the center. Since b2=16, b=4; therefore plot 4 units above and below center. Step 5: Calculate and plot foci. b2=a2 - c2 16 = 25 - c2; c2=9; c = 3. Since foci are on major axis (horizontal in this case), plot 3 units left and right of center. Step 6: Connect endpoint of axes with smooth curve.
How to enter into a calculator. + + Multiply by 16 to isolate y-term. Subtract x-term from both sides. Take the square root of both sides. Add 4 to both sides. Enter in y-editor of calculator.
6-4 Conic Sections: Hyperbolas Geometric Definition: The intersection of a cone and a plane such that the plane is perpendicular to the base of the cone. Algebraic definition: The set of all points in the plane such that the difference of the distances from two fixed points, called foci, remains constant.
Hyperbola Terminology (0,c) f1 Conjugate axis vertex (0,a) Transverse axis (0,b) (c,0) (c,0) f1 Conjugate axis x x Center Center f2 (a,0) (b,0) foci (b,0) (a,0) vertex (0, b) (0, a) Transverse axis f2 foci (0,c) y y slope of asymptotes slope of asymptotes
Example 1: Step 1: Identify if the hyperbola is horizontal (x-term first) or vertical (y-term first). This hyperbola is horizontal since x-term appears first. Step 2: Identify and plot the center (h,k). This hyperbola has a center at (0,0). Step 3: Plot the endpoints of the transverse axis. The transverse axis is horizontal so plot |a| units left and right from center. Since a2=49, a=7; therefore plot 7 units left and right of center. Step 4: Plot the endpoints of the conjugate axis. The conjugate axis is vertical so plot |b| units above and below the center. Since b2=4, b=2; therefore plot 2 units above and below center. Step 5: Draw an a x b rectangle such that each of the axes endpoints is the midpoint of a side of the rectangle; draw the diagonals and extend them. The diagonals are the asymptotes Step 6: Sketch each branch of the hyperbola so that it approaches the asymptotes and passes through the vertex. Step 7: Calculate and plot foci. b2=c2- a2 4 = c2-49; c2=53; c = 7.3. Since foci are on transverse axis (horizontal in this case), plot 7.3 units left and right of center.
Example 2: Step 1: Identify if the hyperbola is horizontal (x-term first) or vertical (y-term first). This hyperbola is vertical since y-term appears first. Step 2: Identify and plot the center (h,k). This hyperbola has a center at (0,0). Step 3: Plot the endpoints of the transverse axis. The transverse axis is vertical so plot |a| units above and below the center. Since a2=36, a=6; therefore plot 6 units above and below the center. Step 4: Plot the endpoints of the conjugate axis. The conjugate axis is horizontal so plot |b| units left and right of the center. Since b2=64, b=8; therefore plot 8 units left and right of the center. Step 5: Draw an a x b rectangle such that each of the axes endpoints is the midpoint of a side of the rectangle; draw the diagonals and extend them. The diagonals are the asymptotes Step 6: Sketch each branch of the hyperbola so that it approaches the asymptotes and passes through the vertex. Step 7: Calculate and plot foci. b2=c2- a2 64 = c2-36; c2=100; c = 10. Since foci are on transverse axis (vertical in this case), plot 10 units above and below the center.
Example 3: Step 1: Identify if the hyperbola is horizontal (x-term first) or vertical (y-term first). This hyperbola is horizontal since x-term appears first. Step 2: Identify and plot the center (h,k). This hyperbola has a center at (4,6). Step 3: Plot the endpoints of the transverse axis. The transverse axis is horizontal so plot |a| units left and right from center. Since a2=25, a=5; therefore plot 5 units left and right of center. Step 4: Plot the endpoints of the conjugate axis. The conjugate axis is vertical so plot |b| units above and below the center. Since b2=36, b=6; therefore plot 6 units above and below center. Step 5: Draw an a x b rectangle such that each of the axes endpoints is the midpoint of a side of the rectangle; draw the diagonals and extend them. The diagonals are the asymptotes Step 6: Sketch each branch of the hyperbola so that it approaches the asymptotes and passes through the vertex. Step 7: Calculate and plot foci. b2=c2- a2 36 = c2-25; c2=61; c = 7.8. Since foci are on transverse axis (horizontal in this case), plot 7.8 units left and right of center.
How to enter into a calculator. Multiply by 36 to isolate y-term. Subtract constant from both sides and add y-term to both sides Take the square root of both sides. Add 6 to both sides. Enter in y-editor of calculator.
Find the equation of a parabola from a graph. Locate the vertex (0, 3) and a point that the parabola passes through (1, 6). Substitute values from above for h, k, x, and y into: Solve for a and then re-write formula. or
Find the equation of a hyperbola from a graph. Locate the center (4, 6) and a point that the parabola passes through (10.25, 10.5). You will most likely be given that point. Determine a2 from graph. a=5 Since horizontal, substitute values from above for a, h, k, x, and y into: