Download
1 / 26
260 likes | 313 Views
Understand the science behind Functional Magnetic Resonance Imaging (fMRI) in this detailed explanation. Explore the physics of NMR, encoding of spatial location, neural activity, and how fMRI forms neural activity images. Learn about excitation, decay, and image formation methods, including 1-D, 2-D, and 3-D spatial encoding techniques. Discover how fMRI measures neural activity related to blood flow, oxygenation, and metabolic functions. Dive into the world of neural imaging and unravel the mysteries of the brain.

E N D
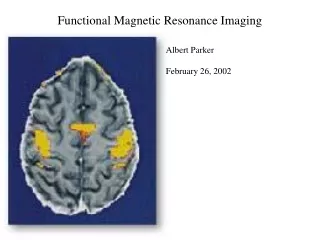
Functional Magnetic Resonance Imaging Albert Parker February 26, 2002
Sources • Functional Magnetic Resonance Imaging Mark S. Cohen, Ph.D Susan Y. Bookheimer, Ph.D. UCLA Brain Mapping Division Trends in Neurooscience http://spinwarp.ucsd.edu/fmri/FMRI-TINS.html) • Journey to the Center of My Mind Stephen S. Hall The New York Times, 6/1999 http://www.fmri.org/jounrey.html • Basics of NMR Joseph P. Hornak Department of Chemistry and Imaging Science Rochester Institute of Technology http://www.cis.rit.edu/htbooks/nmr/bnmr.htm • A Primer on MRI and fMRI Douglas C. Noll, Ph.D. Departments of Biomedical Engineering and Radiology University of Michigan, Ann Arbor, MI 6/2001 http://www.bme.umich.edu/~dnoll/primer2.pdf
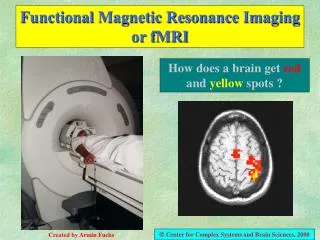
How does fMRI form an image of Neural Activity in the brain?? • Overview of the Physics • Encoding of spatial location • Encoding of neural activity • Experimental procedure
fMRI technology is based on … • Nuclear Magnetic Resonance (NMR)phenomenon (1946, 1950) • high concentration of hydrogen nuclei in biological systems and its high sensitivity to NMR signals. • magnetic susceptibility of oxyhemoglobin and deoxyhemoglobin (1936)
= electron = neutron = proton The Physics of NMRBloch (1946) and Hahn (1950) 1. Atomic nuclei with an odd number of neurons and/or protons have: • a small magnetic moment. • an angular momentum called nuclear spin
The Physics of NMRBloch (1946) and Hahn (1950) 2. Magnetic moments will align (anti) parallel to an applied static magnetic fields. 3. Random atomic collisions and other perturbations allow the system to reach an equilibrium with an excess of protons aligned with the static magnetic field.
Nuclei Unpaired Protons Unpaired Neutrons Net Spin MHz/T The Physics of NMRBloch (1946) and Hahn (1950) 1H 1 0 1/2 42.58 2H 1 1 1 6.54 31P 0 1 1/2 17.25 23Na 2 1 3/2 11.27 14N 1 1 1 3.08 13C 0 1 1/2 10.71 19F 0 1 1/2 40.08 4. If one applies a static magnetic field to nuclei with spin, the magnetization of each nucleus has a resonance (or Larmor) frequency f defined by f = B0 proportionality constant for specific nuclear species (MHz/Tesla) strength of static magnetic field (typically about 1.5 Tesla)
The Physics of NMRBloch (1946) and Hahn (1950) 5. Excitation: If an oscillating magnetic field (called a radio frequency pulse) is applied to nuclei at their resonance frequency, their spins absorb energy, causing the magnetization of the nuclei to precess in phase about the static magnetic field. The precessing magnetization can be measured by a nearby coil.
The Physics of NMRBloch (1946) and Hahn (1950) 6. Decay: Following excitation, the precessing magnetization returns to equilibrium according to exponential decay. • s(t) be an magnetic resonance (MR) signal • T2 is the MR signal decay rate (from a few to tens of ms) The T2 rates are different for different biological tissues! (in particular, for oxyhemoglobin and deoxyhemoglobin!!)
How does fMRI form an image of neural activity?How to form an image of neural activity using NMR? Need to measure:1. Spatial Location2. Neural Activity Magnitude
Spatial Location in 1-D • Frequency Encoding (Lauterbur 1973) • relate frequency linearly to spatial location by B(x) =B0 + Gx· x location in 1-D gradient strength of the static magnetic static field strength “base” strength of the static magnetic field • So the resonance frequency of the nuclei at location x is given by: • f(x) =B(x) = (B0 + Gx· x)
Spatial Location in 1-D amplitude frequency intensity • Take the Fourier transform of the MR signal s(t), F[s(t)], to decompose s(t) into its power spectrum (a signal’s frequencies and associated amplitudes). • In the case of an object composed of a particular medium, we get an image of that object at a particular instant in time: a 1-D distribution of the magnetization intensity at location x: measure s(t) F [s(t)]
Spatial Location in 1-D Frequency Encoding in practice Phase Encoding
Spatial Location in 2-D Echo Planar Imaging (Mansfield 1977): use frequency encoding to determine the “x” direction and echo encoding to determine the “y” direction. sampling windows
Spatial Location in 3-D • Since most humans are 3-D, the third dimension is incorporated into the procedure by performing slice-selective excitation: apply the RF pulse as a function of position in the 3rd dimension (or by moving the static magnetic field along the 3rd dimension).
How to measure neural activity? • The physiology of neural activity involves many complex processes. • MR has the capability to measure parameters related to several neural physiological functions, including: • changes in phosphorus metabolism and metabolic byproducts • blood flow • blood volume • blood oxygenation
Blood oxygen level dependent contrast (BOLD)(Ogawa et al. 1990) • The most common technique used in fMRI. • Takes advantage of the magnetic susceptibility of oxyhemoglobin and deoxyhemoglobin (Pauling 1936). Deoxy Hb has a higher precess magnitization decay rate than does oxy Hb. (They have different T2 rates!) During periods of neuronal activity, local blood flow and volume increase with little or no change in oxygen consumption. As a consequence, the oxygen content of the venous blood is elevated, resulting in an increase in the MR signal.
so fMRI works like this … • Use EPI and slice selective excitation • Apply a static magnetic field with intensity B0. • Use an RF pulse with frequency matching resonance frequency of the desired medium (e.g. hydrogen nuclei) for the given static magnetic field intensity B0. • Apply magnetic field gradients in x and y directions. • Use coils to measure the MR signal s(t). • Calculate F[s(t)] over each sampling window to determine MR signal location in the 2-D slice we have selected. • Take into account how fast the signal has decayed since the RF pulse (T2 decay) when interpreting MR signal “strength” at each location. • Give image intensity
Issues! There is not a one-to-one correspondence between T2 and the neural activity that we are trying to measure. There are pathways that might decrease the decay rate and hence results in a decreased MR signal!
Issues! • Small size in of activation related response leaves it susceptible to noise (low SNR) from: • thermal and electromagnetic noise from the subject • reception coil, preamps and other electronics • quantization noise from analog to digital conversion • cardiac and respiratory cycles • head movement (problem especially for speech tasks) • uncontrolled neuronal events • differences in the manner in which a task is performed • neuronal events associated with behavior unrelated to the task • spontaneous firing of networks • MRI response is delayed and relatively slow compared to brain activity
Dealing with the issues! • rapid data acquisition techniques • special reception coils • increasing static magnetic field intensity • SNR depends on temporal resolution - lower temporal resolution • post-processing techniques, movement correction algorithms, • different gradient systems • multi-shot techniques • head restraints and bite bars • use cortical landmarks
Comparison: temporal and spatial resolution; and invasiveness This figure relates the temporal and spatial resolution of methods for the study of brain function to the size scale of neuronal features and to the “invasiveness” of the methods.
How fMRI stacks up: • temporal resolution: seconds • spatial resolution: cortical columns • invasiveness: apparently completely safe, barring pacemakers “Though few Neuroscientists will be able to afford MR devices of their own … with fMRI it will be possible to perform longitudinal studies on individual subjects advancing the practical spatial resolution of functional imaging and enabling vastly more complex experimental designs …” - Mark Cohen fMRI will not map the cortical and subcortical functions of the human brain, but it has moved us closer to the ideal.