Download

1 / 74
740 likes | 762 Views
Discover the role of citizen science vs. machine technology in providing rapid earthquake information by Dr. David Wald. Learn about ShakeMap and Do You Feel It initiatives and the US Geological Survey's work in earthquake monitoring and response. Gain insights into seismic networks, magnitude vs. intensity, and factors impacting shaking levels.

E N D
Citizen Science: Man vs. Machinein Providing Rapid EarthquakeInformation # 29 Dr. David Wald March 26, 2004 Produced by and for Hot Science - Cool Talks by the Environmental Science Institute. We request that the use of these materials include an acknowledgement of the presenter and Hot Science - Cool Talks by the Environmental Science Institute at UT Austin. We hope you find these materials educational and enjoyable.
Citizen Science:Man versus Machinein Providing Rapid Earthquake Information Dr. David Wald (wald@usgs.gov)United States Geological Survey, Golden, Colorado&Colorado School of Mines, Golden, Colorado U.S. Department of the Interior U.S. Geological Survey
Special Thanks to... The Seismological Society of America The Incorporated Research Institutions for Seismology U.S. Department of the Interior U.S. Geological Survey
Talk Outline… • Brief Overview of Earthquake Hazards • ShakeMap (“Machine”) • “Did You Feel It?” (“Man”) U.S. Department of the Interior U.S. Geological Survey
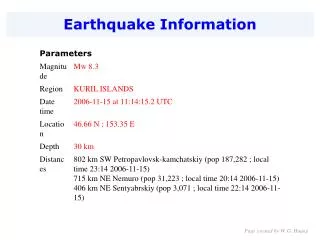
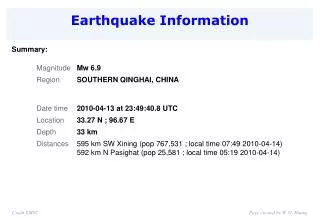
-900 -500 -300 -150 -70 -33 0 USGS National Earthquake Information Center Earthquake Monitoring • The USGS is the federal agency responsible for comprehensive monitoring of earthquakes (nationally & globally) • Rapid reporting of earthquake information for post-earthquake & emergency response • Distribution of earthquake information for public awareness of hazards and mitigation • Data collection and analysis for mitigation research and decision making (land-use and planning, earthquake engineering, retrofit, etc.) Seismic Networks • Advanced National Seismic System (ANSS) • Regional and Urban Seismic Networks • Global Seismograph Network Current World Seismicity
Magnitude Intensity • Represents the size of the earthquake, but not necessarily the damage or shaking level • Represents the effects of an earthquake: the shaking and damage at different locations • Determined by area of the fault and how much it slipped • Determined from observations of shaking and damage • Decimalvalue (e.g., 6.7). Only one value is used for a single earthquake • Roman numerals from I to X are used. The value varies depending on location • Described by the “Richter scale”, though “energy” magnitude is now generally used • The Modified Mercalli IntensityScale is used in U.S.
Earthquake Geology Rupture surface Hypocenter Fault plane Fault trace Epicenter Hypocenter
What Controls the Level of Shaking? • Magnitude • Larger faults, stronger shaking, longer duration, and energy released over a larger area • Distance from fault • Shaking decays with distance • Site Effects • Very soft soils amplify the shaking • Focusing • Local pockets of higher shaking (lens effect) • Directivity (location of epicenter) • Strongest shaking in direction of rupture
1989, magnitude 6.9,Loma Prieta earthquake-damage occurred distant from the epicenter 25 Miles
Depth (in miles) 10 30 50 Effect of Earthquake Depth Northridge, California Magnitude 6.7 Depth ~ 10 km Nisqually, Washington Magnitude 6.8 Depth ~ 50 km I II-III IV V VI VII VIII IX X
A Region of the Advanced National Seismic System (ANSS) Ground Dam, etc. Building Fault Bridge San Simeon 12/22/03 Magnitude 6.5 A Region of the Advanced National Seismic System (ANSS)
San Francisco Bay Area Ground Dam, etc. Building Fault Bridge SAN FRANCISCO BAY AREA LOS ANGELES REGION
1994 Northridge Earthquake (Magnitude 6.7)TriNet Peak Acceleration Map (in %g)
California Statewide Site Classification Map California Division of Mines & Geology (CDMG)
A Portion of theCDMG Preliminary Statewide Site Condition Map of California Pasadena Los Angeles Hard Rock Long Beach Soft Soil
1994 Northridge Earthquake (Magnitude 6.7)TriNet Peak Velocity Map (in cm/sec) Processed: Tue Jun 20 12:05:29 PM PDT, Produced by ShakeMap V2
INSTRUMENTAL INTENSITY SCALE Wald et al., 1999, Earthquake Spectra
1994 Northridge Earthquake (Magnitude 6.7) TriNet Rapid Instrumental Intensity Map Newhall: Intensity IX Collapse of Overpass
http://earthquake.usgs.gov/shakemap http://earthquake.usgs.gov/shakemap
Advanced National Seismic System (ANSS) Regions Puerto Rico and U.S. territories Alaska Hawaii
What are the Primary ShakeMap Uses? • Rapid, post-earthquake emergency response & general information • 2. Enhanced post-earthquake loss estimation • 3. Response planning, preparedness, education • 4. Scientific and engineering studies
Loss Estimation • ShakeMap records shaking levels; it does not give losses. Losses must be estimated separately with a knowledge of building/infrastructure inventory and its vulnerability • The Federal Emergency Management Agency (FEMA) and the California Office of Emergency Services (OES) can now use ShakeMap in HAZUS (Natural Hazard Loss Estimation Methodology) for direct loss estimation from recorded ground motions, rather than from magnitude and epicenter alone • Loss estimates guide federal/state response efforts
TMC Photo CALTRANS OAKLAND TMC EMERGENCY RESPONSE
Caltrans GIS (Geographic Information Systems) Map of Highway Bridges and Overpasses
SEISMIC HAZARD MAPRED AREAS HAVE HIGHEST HAZARD Southern San Andreas Fault: Magnitude ~ 7.8, about every 200 years
Scenario ShakeMap: San Andreas Fault (Magnitude 7.8) PLANNING SCENARIO ONLY – PROCESSED: Fri Feb 15, 2002 11:35:47 AM PST
Scenario ShakeMap: Verdugo Hills Fault (Magnitude 6.7) Los Angeles County Office of Emergency Management Training Scenario, November 9, 2000 LA County Emergency Operations Center
Community Internet Intensity Maps (CIIM) “Did You Feel It?” (DYFI?)
Citizen science citizen science
Answers to these specific questions are very diagnostic of earthquake intensity. • Answers to these specific questions are very diagnostic of earthquake intensity • The system is calibrated against intensities from past earthquakes • The responses are averaged for each zip code area, and color-coded for the intensity in that zip region
1994 Northridge Earthquake (Magnitude 6.7) Comparison of USGS Modified Mercalli Intensity (Colored Circles) with USGS Community Intensity (DYFI?; Colored Zip Codes)