Download
1 / 10
100 likes | 240 Views
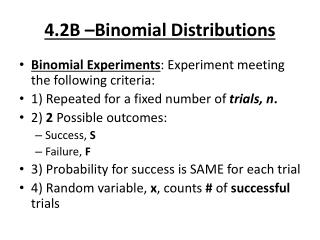
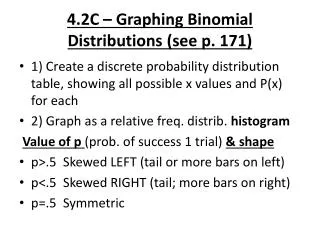
4.2C – Graphing Binomial Distributions (see p. 171). 1) Create a discrete probability distribution table, showing all possible x values and P(x) for each 2) Graph as a relative freq. distrib . histogram Value of p (prob. of success 1 trial) & shape

E N D
4.2C – Graphing Binomial Distributions (see p. 171) • 1) Create a discrete probability distribution table, showing all possible x values and P(x) for each • 2) Graph as a relative freq. distrib. histogram Value of p (prob. of success 1 trial) & shape • p>.5 Skewed LEFT (tail or more bars on left) • p<.5 Skewed RIGHT (tail; more bars on right) • p=.5 Symmetric
Population Parameters of a Binomial Distribution • Can use mean, variance & standard deviation formulas from 4.1, BUT if it is a BINOMIAL distribution, then easier formulas can be used! (No complex table needed!!!) • MEAN= μ = np(n=#trials, p=prob.of success • Variance = σ² = npq(q= prob. of failure) • Standard deviation = σ = √σ² = √npq
Example • In Pittsburg, 57%of the days in a year are cloudy. Find the mean, variance and standard deviation for the # of cloudy days in the month of June.
Example • In Pittsburg, 57%of the days in a year are cloudy. Find the mean, variance and standard deviation for the # of cloudy days in the month of June. n= 30 = # days in June p=.57 q=.43 (1-.57)
Example • In Pittsburg, 57%of the days in a year are cloudy. Find the mean, variance and standard deviation for the # of cloudy days in the month of June. n= 30 = # days in June p=.57 q=.43 (1-.57) Mean = μ = np =
Example • In Pittsburg, 57%of the days in a year are cloudy. Find the mean, variance and standard deviation for the # of cloudy days in the month of June. n= 30 = # days in June p=.57 q=.43 (1-.57) Mean = μ = np = 30(.57) = 17.1
Example • In Pittsburg, 57%of the days in a year are cloudy. Find the mean, variance and standard deviation for the # of cloudy days in the month of June. n= 30 = # days in June p=.57 q=.43 (1-.57) Mean = μ = np = 30(.57) = 17.1 Variance = σ² = npq =
Example • In Pittsburg, 57%of the days in a year are cloudy. Find the mean, variance and standard deviation for the # of cloudy days in the month of June. n= 30 = # days in June p=.57 q=.43 (1-.57) Mean = μ = np = 30(.57) = 17.1 Variance = σ² = npq = 30(.57)(.43) = 7.353
Example • In Pittsburg, 57%of the days in a year are cloudy. Find the mean, variance and standard deviation for the # of cloudy days in the month of June. n= 30 = # days in June p=.57 q=.43 (1-.57) Mean = μ = np = 30(.57) = 17.1 Variance = σ² = npq = 30(.57)(.43) = 7.353 Standard deviation = σ = √σ²
Example • In Pittsburg, 57%of the days in a year are cloudy. Find the mean, variance and standard deviation for the # of cloudy days in the month of June. n= 30 = # days in June p=.57 q=.43 (1-.57) Mean = μ = np = 30(.57) = 17.1 Variance = σ² = npq = 30(.57)(.43) = 7.353 Standard deviation = σ = √σ² =√7.353 = 2.71