Download
1 / 9
100 likes | 128 Views
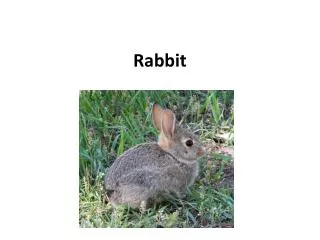
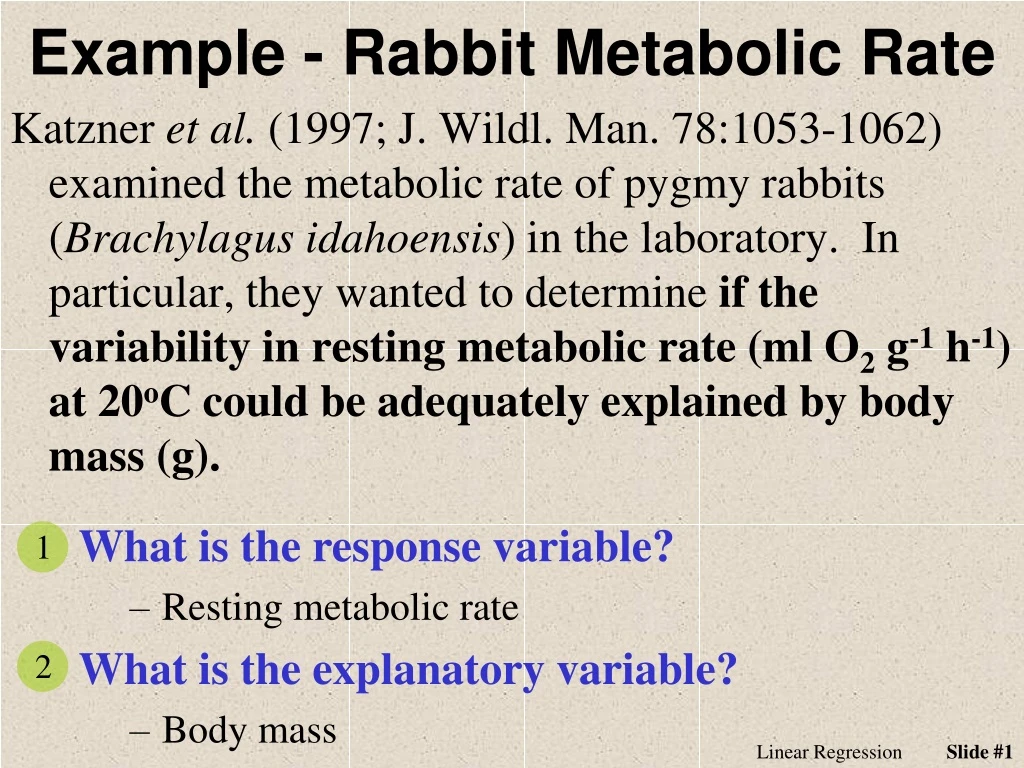
This study examines the metabolic rate of pygmy rabbits and its relation to body mass. Researchers explored if variability in resting metabolic rate at 20°C can be explained by body mass. The results provide insights into metabolic trends in small mammals.

E N D
1 2 Example - Rabbit Metabolic Rate Katzneret al. (1997; J. Wildl. Man. 78:1053-1062) examined the metabolic rate of pygmy rabbits (Brachylagusidahoensis) in the laboratory. In particular, they wanted to determine if the variability in resting metabolic rate (ml O2 g-1 h-1) at 20oC could be adequately explained by body mass (g). • What is the response variable? • Resting metabolic rate • What is the explanatory variable? • Body mass Linear Regression
3 Example - Rabbit Metabolic Rate 1.0 In terms of the variables of the problem, what is the equation of the best-fit line? Metabolic Rate 0.9 MetRate = 1.41-0.00124Mass 0.8 400 450 500 Mass Y = 1.41 - 0.00124X R-Sq = 55.4 % Linear Regression
4 Example - Rabbit Metabolic Rate In terms of the variables of the problem, interpret the value of the slope? 1.0 Metabolic Rate 0.9 For each additional gram of mass, the metabolic rate decreases 0.00124 ml O2 g-1 h-1on average 0.8 400 450 500 Mass Y = 1.41 - 0.00124X R-Sq = 55.4 % Linear Regression
5 Example - Rabbit Metabolic Rate In terms of the variables of the problem, interpret the value of the y-intercept? 1.0 Metabolic Rate 0.9 Rabbits with no mass have a metabolic rate of 1.41 ml O2 g-1 h-1on average 0.8 400 450 500 Mass Y = 1.41 - 0.00124X R-Sq = 55.4 % Linear Regression
6 1.0 Metabolic Rate 0.9 0.8 400 450 500 Mass Example - Rabbit Metabolic Rate What is the predicted metabolic rate for a mass of 450 g? MetRate = 1.41-0.00124Mass (450,0.85) MetRate = 1.41-0.00124*450 MetRate = 0.85 Y = 1.41 - 0.00124X R-Sq = 55.4 % Linear Regression
7 1.0 Metabolic Rate 0.9 0.8 400 450 500 Mass Example - Rabbit Metabolic Rate What is the predicted metabolic rate for a mass of 600 g? Y = 1.41 - 0.00124X R-Sq = 55.4 % Linear Regression
8 1.0 Metabolic Rate 0.9 0.8 400 450 500 Mass Example - Rabbit Metabolic Rate What is the residual for a mass of 425 g and a metabolic rate of 0.82 ml O2 g-1 h-1? (425,0.88) Resid = Obs Y – Pred Y (425,0.82) Resid = 0.82-(1.41-0.00124*425) Resid = 0.82-0.88 Resid = -0.06 Y = 1.41 - 0.00124X R-Sq = 55.4 % Linear Regression
9 10 Example - Rabbit Metabolic Rate What proportion of the variability in metabolic rate is explained by knowing mass? 1.0 Metabolic Rate 0.9 r2 = 0.554 What is the correlation between metabolic rate and mass? 0.8 400 450 500 Mass r = 0.5540.5 - Y = 1.41 - 0.00124X r = 0.744 R-Sq = 55.4 % Linear Regression
11 Example - Rabbit Metabolic Rate Does anything about this regression concern you? 1.0 Metabolic Rate 0.9 0.8 400 450 500 Mass Y = 1.41 - 0.00124X R-Sq = 55.4 % Linear Regression