Testing Multivariate Assumptions
Testing Multivariate Assumptions.

Testing Multivariate Assumptions
E N D
Presentation Transcript
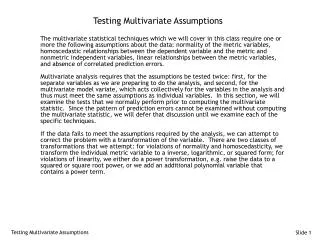
Testing Multivariate Assumptions The multivariate statistical techniques which we will cover in this class require one or more the following assumptions about the data: normality of the metric variables, homoscedastic relationships between the dependent variable and the metric and nonmetric independent variables, linear relationships between the metric variables, and absence of correlated prediction errors. Multivariate analysis requires that the assumptions be tested twice: first, for the separate variables as we are preparing to do the analysis, and second, for the multivariate model variate, which acts collectively for the variables in the analysis and thus must meet the same assumptions as individual variables. In this section, we will examine the tests that we normally perform prior to computing the multivariate statistic. Since the pattern of prediction errors cannot be examined without computing the multivariate statistic, we will defer that discussion until we examine each of the specific techniques. If the data fails to meet the assumptions required by the analysis, we can attempt to correct the problem with a transformation of the variable. There are two classes of transformations that we attempt: for violations of normality and homoscedasticity, we transform the individual metric variable to a inverse, logarithmic, or squared form; for violations of linearity, we either do a power transformation, e.g. raise the data to a squared or square root power, or we add an additional polynomial variable that contains a power term. Testing Multivariate Assumptions
Testing Multivariate Assumptions - 2 Transforming variables is a trial and error process. We do the transformation and then see if it has corrected the problem with the data. It is not usually possible to be certain in advance that the transformation will correct the problem; sometimes it only reduces the degree of the violation. Even when the transformation might decrease the violation of the assumption, we might opt not to include it in the analysis because of the increased complexity it adds to the interpretation and discussion of the results. It often happens that one transformation solves multiple problems. For example, skewed variables can produce violations of normality and homoscedasticity. No matter which test of assumptions identified the violation, our only remedy is a transformation of the metric variable to reduce the skewness. Testing Multivariate Assumptions
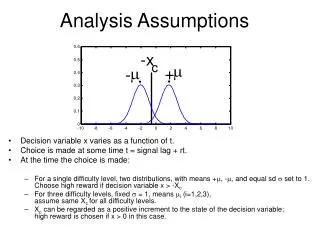
1. Evaluating the Normality of Metric Variables Determining whether or not the distribution of values for a metric variable complies with the definition of a normal curve is tested with histograms, normality plots, and statistical tests. The histogram shows us the relative frequency of different ranges of values for the variable. If the variable is normally distributed, we expect the greatest frequency of values to occur in the center of the distribution, with decreasing frequency for values away from the center. In addition, a normally distributed variable will be symmetric, showing the same proportion of cases in the left and right tails of the distribution. In a normality plot in SPSS, the actual distribution of cases is plotted in red against the distribution of cases that would be expected if the variable is normally distributed, plotted as a green line on the chart. Our conclusion about normality is based on the convergence or divergence between the plot of red points and the green line. There are two statistical tests for normality: the Kolmogorov-Smirnov statistic with the Lilliefors correction factor for variables that have 50 cases or more, and the Shapiro-Wilk's test for variables that have fewer than 50 cases. SPSS will compute the test which is appropriate to the sample size. The statistical test is regarded as sensitive to violations of normality, especially for a large sample, so we should examine the histogram and normality plot for confirmation of a distribution problem. The statistical test for normality is a test of the null hypothesis that the distribution is normal. The desirable outcome is a significance value for the statistic more than 0.05 so that we fail to reject the null hypothesis. If we fail to reject the null hypothesis, we conclude that the variable is normally distributed and meets the normality assumption. If the significance value of the normality test statistic is smaller than 0.05, we reject the null hypothesis of normality and see if a transformation of the variable can induce normality to meet the statistical assumption. Testing Multivariate Assumptions
Requesting Statistics to Test Normality Testing Multivariate Assumptions
Requesting the Plot to Test Normality Testing Multivariate Assumptions
Output for the Statistical Tests of Normality Testing Multivariate Assumptions
The Histogram for Delivery Speed (X1) Testing Multivariate Assumptions
The Normality Plot for Delivery Speed (X1) Testing Multivariate Assumptions
The Histogram for Price Level (X2) Testing Multivariate Assumptions
The Normality Plot for Price Level (X2) Testing Multivariate Assumptions
Transformations to Induce Normality Testing Multivariate Assumptions
Computing the Square Root Transformation for Price Level Testing Multivariate Assumptions
Request the Normality Analysis for the Transformed Price Level Variable Testing Multivariate Assumptions
The K-S Lilliefors Test for the Transformed Price Level Variable Testing Multivariate Assumptions
The Histogram for the Transformed Price Level Variable Testing Multivariate Assumptions
The Normality Plot for the Transformed Price Level Variable Testing Multivariate Assumptions
The Histogram for Price Flexibility (X3) Testing Multivariate Assumptions
The Normality Plot for Price Flexibility (X3) Testing Multivariate Assumptions
Computing the Square Root Transformation for Price Flexibility Testing Multivariate Assumptions
Computing the Logarithmic Transformation for Price Flexibility Testing Multivariate Assumptions
Computing the Inverse Transformation for Price Flexibility Testing Multivariate Assumptions
Request the explore command for the three transformed variables Testing Multivariate Assumptions
The K-S Lilliefors tests for the transformed variables Testing Multivariate Assumptions
2. Evaluating Homogeneity of Variance for Non-metric Variables The Levene statistic tests for equality of variance across subgroups on a non-metric variable. The null hypothesis in the test is that the variance of each subgroup is the same. The desired outcome is a failure to reject the null hypothesis. If we do reject the null hypothesis and conclude that the variance of at least one of the subgroups is not the same, we can use a special formula for computing the variance if one exists, such as we do with t-tests, or we can apply one of the transformations used to induce normality on the metric variable. While the Levene statistic is available through several statistical procedures in SPSS, we can obtain it for any number of groups using the One-way ANOVA Procedure. We will demonstrate this test by checking the homogeneity of variance for the metric variables 'Delivery Speed', Price Level', 'Price Flexibility', 'Manufacturer Image', 'Service', 'Salesforce Image', 'Product Quality', Usage Level', and 'Satisfaction Level' among the subgroups of the non-metric variable 'Firm Size.' Testing Multivariate Assumptions
Requesting a One-way ANOVA Testing Multivariate Assumptions
Request the Levene Homogeneity of Variance Test Testing Multivariate Assumptions
The Tests of Homogeneity of Variances Testing Multivariate Assumptions
Compute the Transformed Variables for 'Manufacturer Image' (x4) Testing Multivariate Assumptions
Request the Levene Test for the Transformed Manufacturer Image Variables Testing Multivariate Assumptions
Levene Test Results for the Transformed Manufacturer Image Variables The results of the Levene Tests of Homogeneity of Variances indicate that none of the transformations are effective in resolving the homogeneity of variance problem for the subgroups of Firm Size on the variable Product Quality. We would note the problem in our statement about the limitations of our analysis. Testing Multivariate Assumptions
Compute the Transformed Variables for 'Product Quality' (x7) Testing Multivariate Assumptions
Request the Levene Test for the Transformed Product Quality Variables Testing Multivariate Assumptions
Results of the Levene Test for the Transformed Product Quality Variables The results of the Levene Tests of Homogeneity of Variances indicate that either the logarithmic transformation or the square root transformation are effective in resolving the homogeneity of variance problem for the subgroups of Firm Size on the variable Product Quality. Testing Multivariate Assumptions
3. Evaluate Linearity and Homoscedasticity of Metric Variables with Scatterplots Other assumptions required for multivariate analysis focus on the relationships between pairs of metric variables. It is assumed that the relationship between metric variables is linear, and the variance is homogenous through the range of both metric variables. If both the linearity and the homoscedasticity assumptions are met, the plot of points will appear as a rectangular band in a scatterplot. If there is a strong relationship between the variables, the band will be narrow. If the relationship is weaker, the band becomes broader. If the pattern of points is curved instead of rectangular, there is a violation of the assumption of linearity. If the band of points is narrower at one end than it is at the other (funnel-shaped), there is a violation of the assumption of homogeneity of variance. Violations of the assumptions of linearity and homoscedasticity may be correctable through transformation of one or both variables, similar to the transformations employed for violations of the normality assumption. A diagnostic graphic with recommended transformations is available in the text on page 77. SPSS provides a scatterplot matrix for examining the linearity and homoscedasticity for a set of metric variables as a diagnostic tool. If greater detail is required, a bivariate scatterplot for pairs of variables is available. We will request a scatterplot matrix for the eight metric variables from the HATCO data set in the scatterplot matrix on page 43 of the text. None of the relationships in this scatterplot matrix shows any serious problem with linearity or heteroscedasticity, so this exercise will not afford the opportunity to examine transformations. Examples of transformations to achieve linearity will be included in the next set of exercises titled A Further Look at Transformations. Testing Multivariate Assumptions
Requesting the Scatterplot Matrix Testing Multivariate Assumptions
Specify the Variables to Include in the Scatterplot Matrix Testing Multivariate Assumptions
Add Fit Lines to the Scatterplot Matrix Testing Multivariate Assumptions
Requesting the Fit Lines Testing Multivariate Assumptions
Changing the Thickness of the Fit Lines Testing Multivariate Assumptions
Changing the Color of the Fit Lines Testing Multivariate Assumptions
The Final Scatterplot Matrix Testing Multivariate Assumptions