Project
400 likes | 681 Views
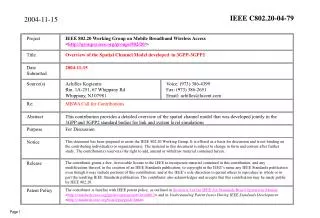
Project. IEEE 802.20 Working Group on Mobile Broadband Wireless Access < http://grouper.ieee.org/groups/802/20/ >. Title. Overview of the Spatial Channel Model developed in 3GPP-3GPP2 . Date Submitted. 2004-11-15. Source(s). Achilles Kogiantis Rm. 1A-251, 67 Whippany Rd

Project
E N D
Presentation Transcript
Project IEEE 802.20 Working Group on Mobile Broadband Wireless Access <http://grouper.ieee.org/groups/802/20/> Title Overview of the Spatial Channel Model developed in 3GPP-3GPP2 Date Submitted 2004-11-15 Source(s) Achilles Kogiantis Rm. 1A-251, 67 Whippany Rd Whippany, NJ 07981 Voice: (973) 386-4399Fax: (973) 386-2651 Email: achilles@lucent.com Re: MBWA Call for Contributions Abstract This contribution provides a detailed overview of the spatial channel model that was developed jointly in the 3GPP and 3GPP2 standard bodies for link and system level simulations Purpose For Discussion Notice This document has been prepared to assist the IEEE 802.20 Working Group. It is offered as a basis for discussion and is not binding on the contributing individual(s) or organization(s). The material in this document is subject to change in form and content after further study. The contributor(s) reserve(s) the right to add, amend or withdraw material contained herein. Release The contributor grants a free, irrevocable license to the IEEE to incorporate material contained in this contribution, and any modifications thereof, in the creation of an IEEE Standards publication; to copyright in the IEEE’s name any IEEE Standards publication even though it may include portions of this contribution; and at the IEEE’s sole discretion to permit others to reproduce in whole or in part the resulting IEEE Standards publication. The contributor also acknowledges and accepts that this contribution may be made public by IEEE 802.20. Patent Policy The contributor is familiar with IEEE patent policy, as outlined in Section 6.3 of the IEEE-SA Standards Board Operations Manual<http://standards.ieee.org/guides/opman/sect6.html#6.3> and in Understanding Patent Issues During IEEE Standards Development <http://standards.ieee.org/board/pat/guide.html>. 2004-11-15
Overview of the Joint 3GPP 3GPP2 Spatial Channel Model Recommendation Achilles Kogiantis 802.20 Session 11 San Antonio, TX November 17, 2004
SCM standards activity • A joint adhoc was created by 3GPP and 3GPP2 to specify spatial channel models (April 2002) • The adhoc group completed its task in June 2003. • Recommendation to 3GPP RAN1 was adopted as permanent document TR 25.996 • Recommendation to 3GPP2 WG3 made in June 2003 • SCM Participating Companies: Mitsubishi Motorola Nokia Nortel Networks Panasonic Samsung Spirent Communications Telia Texas Instruments TTPCom Qualcomm Atelier Telecom DISA Elektrobit Ericsson ETRI France Telecom Infineon Interdigital IP Wireless LG Electronics Lucent Technologies MERL
SCM Approach • The SCM AHG work was intended to be an extension to the available evaluation methodology for multiple antenna studies • The add-on features of the SCM recommendations are: • System Level channel modeling are the core specifications (link level definitions are also provided for calibration) • The wideband model addresses both 1.25MHz and 5MHz channel bandwidths • Modeling is developed as a general framework for multiple antenna transmit and/or receive configurations • No specific antenna topologies are enforced. Specifications are independent of antenna arrangements • Specifications reflect on numerous measurement campaigns and literature surveys (also COST 259 recommendations) • The SCM AHG sought a balance between the representation of realistic spatial environments and modeling complexity.
SCM Structure • System Level Model • Each drop is assigned spatial-temporal parameters from pre-determined distributions • Evaluation Methodology specifications • Define the methods to be used for utilizing the SCM in system level simulations. • Objective is not to deviate from currently established methodologies • Link Level Model • Contains a specific set of fixed spatial-temporal parameters • Used for calibration purposes only
System Level SCM – Channel Scenarios • Choose a Channel Scenario common to all drops. Each channel scenario defines a specific set of typical physical parameter values. • Suburban Macro • BS-BS distance aprox. 3Km. BS antenna position: High • Describes small angle spread (AS), small delay spread (DS) environments: rural areas • Urban Macro • BS-BS distance aprox. 3Km. BS antenna position: High • Describes moderate to high AS, large DS environments: large cells with urban buildings in the vicinity; significant scattering • Urban Micro • BS-BS distance aprox. 1Km • Describes large AS, moderate DS environments. BS antenna located at rooftop. Small urban cells with a wide range of per drop AS,DS values • Additional modeling options: • Line of Sight (LOS). Applicable to urban micro • Far Scatterer Cluster. Applicable to urban macro. Models the bad urban case. • Urban Canyon. Applicable to urban macro
System channel model overview Suburban macro Urban macro Urban micro 1. Choose scenario 2. Determine user parameters Angle spread Lognormal shadowing Delay spread Pathloss Orientation, Speed Vector Antenna gains Angles of departure (paths) Angles of departure (subpaths) Path delays Average path powers Angles of arrival (paths) Angles of arrival (subpaths) Far scattering cluster(urban macro) Urban canyon(urban macro) Polarization LOS (urban micro) Options 3. Generate channel coefficients
Pathloss - Shadowing • Macro channels follow the Hata COST 231 • Urban micro follows the Walfish-Ikegami pathloss model
Correlation of Narrowband Parameters • Site to Site Correlation = 0.5 • Correlation between Angle Spread, Delay Spread, Shadowing (LN) : • Define and as iid Gaussian, N(0,1) with BS index (n = 1 …N). Intra-site correlations Site to site correlation
Generation of Narrowband Parameters • For a given channel scenario draw random lognormal realizations for AS, DS, LN ( ) in an MS drop and for each BS n : • The distributions are a priori determined. • Each macro channel scenario is characterized by a unique set of mean, variance values:
Macro Narrowband Statistics • Angle Spead, Delay Spead lognormal distributions (model and simulated)
Wideband Characterization After narrowband parameters are drawn per drop, the per-path details are specified: • Generate Power Delay Profile (PDP) (path delays, path powers) • PDP is generated using N=6 paths (for all scenarios) • Generate per-path Angle of Arrival and Angle spread • Each path is assigned fixed angle spread with Laplacian Angular Power Spectrum at BS • Each path is assigned fixed angle spread with Laplacian Angular Power Spectrum at MS • Angle of Departure of each path at BS is Gaussian distributed • Angle of Arrival at MS is a Gaussian random variable but also a function of the path power
Power Distribution Parameter PAS Example: If Powers are assigned completely random in angle, sPAS = sAoDso rAS = 1.0 When there is a trend of having stronger powers in the direction of the MS, sPAS < sAoDthus rAS > 1.0 rDS = (sdelays/sDS) rAS = (sAoD/sPAS) sPAS = sAoD sAoD sPAS Values for rDS & rAS were selected based on measurements
Power Delay Profile - Macro Steps 4,5 - Power Delay Profile (PDP): • PDP is not deterministic as in ITU models • N=6 distinct paths are present at any time. • Generate random delays for each path (exponentially distributed intervals from zero): • Order delays and shift so as 1st path has zero delay. Quantize delays to 1/16 of chip interval. • Generate relative powers for each path (exponential profile with shadowing randomization). Step 6 – AOD Generation per path at BS • Gaussian random AODs centered on the LOS direction: • With r = 1.2 (suburban macro), r = 1.3 (urban macro) Step 7 – PDP to AOD assignments: • Order AODs in increased absolute value • Assign path delays (in increasing order) to the ordered AODs.
Special Definitions - Micro Steps 4,5 - Power Delay Profile (PDP): • Generate random delays for each path; uniformly distributed: • Order delays and shift so as 1st path has zero delay. Quantize delays to 1/16 of chip interval. • Generate relative powers for each path (exponential profile with independent path shadowing). Step 6 – AOD Generation per path at BS • Uniformly distributed random AODs centered on the LOS direction: Step 7 – PDP to AOD assignments: • No ordering of path AODs
Path Angle Spread Generation Step 8 – Per path channel generation at BS • M=20 sub-paths used for each path, all equal power, unequal angle spacing • 2o per path angle spread for macro • 5o per path angle spread for urban micro • Sub-path angles precalculated and fixed for all realizations • Laplacian power azimuth spectrum, random phases.
Path AOA Distribution at Mobile Step 9 – Path Angle of Arrival (AOA) at the MS • Per path AOA is a Gaussian random variable. • Path AOA variance decreases with the path’s relative power. • sAoA = 104.12(1-exp(-0.2175*|Pr|) • Per path AOA: Measurements provided By Motorola MS Path Angle of Arrival Strong Medium Weak Prob(dBr) s(dBr) LOS - 180o LOS LOS + 180o
Path Angle Spread at Mobile Step 10 – Per path channel generation at MS: • 20 sub-paths used for each path, all equal power, unequal angle spacing • 35o per path angle spread for all scenarios • Sub-path angles precalculated and fixed for all realizations • Laplacian power azimuth spectrum, random phases. Steps 11,12 – Pairing of BS-MS sub-paths, antenna gains. • Random pairing of sub-paths • Assign antenna gains for BS and MS
SCM Generation The per path channel realization between a Tx-Rx antenna pair is a superposition of oscillators • Only one quantity is time evolving. • All other quantities are fixed for duration of the drop at initialization
Model for Polarized Antennas Model defined to allow any type of polarized antennas on the z-plane by decomposition into vertical & horizontal polarizations • Power mixing between Vertical (P1) and Horizontal (P2) pols is defined by a discrimination function: XPD=P1/P2 • For urban channels: P2 = P1 - A - B*N(0,1) (B is the St.Dev of XPD) where: • Urban macro: A=0.34*(mean relative path power)+7.2 dB, and B=5.5dB • Urban micro: A=8 dB, and B=8dB • Fast Fading between the two pols is independent • For each subpath on one pol a corresponding subpath is generated on the other pol with a different initial phase • The propagation characteristics of V-to-V paths are assumed to be similar to the propagation characteristics of H-to-H paths. • Example (X-pol transmit, X-pol receive): If BS transmits in X-pol then all path components are decomposed to V and H ones, a mixing is generated, and re-assembled at the Xpol receiver
SCM Polarized Generation A matrix describes the amplitude mixing • Definitions follow the single polarization case ones
Antenna Patterns SCM Model allows any mix of antenna patterns in the MS or BS array Only single polarization antennas defined in SCM Base Station: • 3-sector and 6-sector antennas defined • 3-sector: • 6 sector: Mobile: • Omnidirectional antenna at the X-Y plane at –1 dBi
Far Scattering ClusterBad Urban Model The modified procedure includes: 1. Drop MS within test cell as usual. 2. Drop three FS clusters uniformly across the cell hexagon, with a minimum radius of R = 500m. 3. Choose the FS cluster to use for the mobile that is closest to the mobile. 4. Main cluster is assigned 4 paths, FSC assigned 2 paths 5. Assign Powers, and delays based with the FSC components modified by: Excess delay due to path length 1dB/uS additional attenuation 6. Independent shadow fading per cluster. 50% STS correlation applied 7. Normalize powers of the 6 paths to unity power. Result: Angle Spread and Delay Spread is increased as in a bad urban environment
Line of Sight Model Applied to Micro-cell • Probability of occurrence is ~ 15% • Cost 231 Walfisch-Ikegami for NLOS 2.0 GHz: 34.53 + 38*log10(d), d in meters Log Normal = 10 dB • Cost 231 Walfisch-Ikegami Street Channeling Model for LOS 2.0 GHz: 30.18 + 26*log10(d), d in meters Log Normal = 4 dB Mixing function (Probability of occurrence): K-factor for LOS component: K = 13.0 – 0.03*d, K in dB, d < 300m A direct component is added to first arriving path, normalized with 6 other paths to unity power and ratio K (dB) Result: Angle Spread, Delay Spread, and Path Loss statistics affected by LOS component
Urban Canyon ModelNo building grid required • Select a random street orientation which equals the direction of UE movement. • Select a random orientation for the subscriber antenna array • If b = U(0,1)<= 0.9 Select the UE AoAs for all arriving paths to be equal • If b > 0.9 Select the directions of arrival for all paths using the standard SCM MS AoA model. This model emphasizes the case of all paths arriving from a common direction. Each Path has a AS = 35°, producing this minimum value for 90% of the mobiles. The remaining 10% of cases represent a mix of other cases, with more random paths.
Calibration – Output StatisticsMicro • Composite Angle Spead at BS and Delay Spead distributions in NLOS and LOS cases of urban micro
Calibration – Output StatisticsMicro (II) • Composite Angle Spread distribution in NLOS and LOS cases of urban micro at the MS • Complementary CDF of resolvable path power in dBr:
Path Statistics • Number of resolvable paths (fingers) as determined by the finger assignment procedure • Receiver-based finger assignment assumes 1.2288Mcps and root raised cosine filters with roll-off factor beta=0.22 Suburban Macro Urban Macro
Path Statistics (II) • Number of resolvable paths (fingers) as determined by the finger assignment procedure • Assumes NLOS case. Urban Micro
Evaluation Methodology Ioc Modeling • Explicit Spatial modeling of some of the interfering sources. Channel Metric to FER mappings • Proposal proponent should provide metric. • An MMSE space-time receiver can be specified as a reference example design for advanced receivers. • For most SIMO/MISO schemes the current methodology is sufficient • For SIMO/MIMO schemes the use of the MMSE receiver offers a reference design Ray Mapping • Mapping of SCM paths into fingers for RAKE receivers
Ioc Modeling • Sophisticated receivers account for spatial characteristics of signals from interfering bases. • Need to model the spatial characteristics of “strongest” B bases. (B = 8 for 120 degree sectors, B = 12 for 60 degree sectors.) • Remaining bases are modeled as spatially white to reduce complexity. • The impact of the Ioc components depends heavily on the receiver algorithm • Methodology: • Determine the pathloss (including antenna patterns) and shadowing of all bases. • Rank bases in order of received power. • Assign the strongest base as the serving base. • Model the next strongest B bases as spatially correlated Gaussian noise processes whose covariances are determined by their channel matrices. • Model the remaining bases as spatially white Gaussian noise processes whose variances are based on a flat Rayleigh fading process.
Ray Mapping • Path delays appear at a resolution of 1/16 chip interval • A ray mapping method is needed for RAKE receivers to map the paths into resolvable paths. • The SCM AHG is recommending a finger assignment procedure: • Determine F number of finger positions common to all receiver antennas. Calculate the local maxima of the channel convolution that include the transmit and receive filters. Valid local maxima are only those who satisfy both of the constraints below: • A local maximum must be within 14dB from the highest local maximum. • No two consecutive local maxima can be temporally located less than a chip interval apart (i.e. local maxima within a chip interval away from a previously selected maximum are ignored) • Calculate the power contribution of each of the N paths to each finger assigned.
SCM Complexity in System Simulations Initialization: • Performed once per drop. Stores geometrical, temporal, and spatial variables • No computational impact in system level simulations Runtime: • With M=20 sub-paths per path the number of calculations per Tx-Rx antenna pair and channel sample (e.g. once per slot) are comparable to those in typical channel models • Complexity increases linearly with the number of Tx - Rx antennas • Polarization doubles the amount of calculations • LOS, FSC, Urban Canyon do not impact complexity • Ioc modeling: modeling the spatial parameters of B sectors per MS multiplies the complexity (factor of B) • Ray mapping procedure executed per Tx-Rx antenna pair is a linear transformation (minimal impact) • Overhead from Advanced Receiver (e.g. MMSE) is additional but minor
Link Level Models • Link Level are considered. Models are a representative set of SCM implementations with fixed parameters. • Link Level models can be used for calibration purposes.
Summary • The SCM recommendation is a comprehensive system level framework for evaluation of multiple antenna techniques. • The MBWA has already adopted most of the SCM modeling principles and has also extended the specification for additional (indoor) environments