Download

1 / 26
260 likes | 279 Views
Join Donald Donais as he demonstrates the power of Excel's Get & Transform feature to extract, transform, and analyze data from SharePoint effortlessly. Learn how to connect to various data sources, transform data, and create compelling reports for insightful analysis. Discover the versatility of Excel for data visualization and sharing in SharePoint.

E N D
Become an Excel Power User - Connecting and Analyzing Your SharePoint Data Donald Donais Minnesota SharePoint Users Group – April 2019
Donald Donais Office 365/Enterprise Collaboration Manager Husband & Father (Ages 17 & 14) Twitter: @dondonais Email: ddonais@spdrummer.net
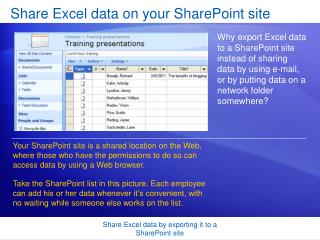
Export to Excel • Available with most version of SharePoint • Export list or library information including: • Contacts • Calendar • Tasks • Issues • Custom List • Discussion Board • Document Library • Exports the columns displayed in view • Creates an .iqy (query) file • Can refresh data from SharePoint to get updates • Works with 2013 to current versions of Excel
Nice, but . . . • Transformation of data happens after export • Will lose transformations on refresh of data • Need to rely on calculations for data normalization • Issue with large lists not exporting correctly • Reliant on the filtered SharePoint list view • Feature requires Internet Explorer add-ins
Demo Export to Excel
Get & Transform in Excel • Newer version of Power Query • Available as add-in for Excel 2010 or 2013 • Built in for Excel 2016 and newer • Get & Transform/Power Query is also found in Power BI
What does Get & Transform do? • Connect to your data source: local, in a service or cloud • Transform or shape the data to meet needs • Combine with other data sources to create a data model • Share the query with others through saving, sharing or reports
Connect to Data • Connections include: • Excel or CSV files • Access, SQL Server, Oracle, MySQL, Azure database • Web sites, SharePoint lists, Facebook, Salesforce, and much more
Transform & Combine • Does not change the data in the data source • Easy to change for own needs • Changing the data type • Adding a calculated column • Removing a column • Merging or appending tables . . . • Query Editor to easily transform the data • Advanced Editor available using M Language • Transformations stay when refreshing
Share • Make Query available through Power BI Data Catalog • Publish to Power BI • Create reports using data • Save Excel in SharePoint or OneDrive and share • Use Excel Services to display within SharePoint
Demo Connect – to SharePoint Lists Transform – data for analysis
Analyzing Data Using Excel • Conditional Formatting • Built In or Custom Rules • Provide visual cues about data using color • Cell and text formatting • Color Scales • Data Bars • Icon Sets • Rules Manage
Analyzing Data Using Excel • Pivot Tables/Charts • Easy way to analyze a lot of data • Consolidate based on a recurring value • Quickly add calculations and summarize data • Use Pivot Charts to quickly convey a story
Analyzing Data Using Excel • Charts • Illustrate data graphically • Chart Types include: • Bar • Line • Pie • Column • Surface • Maps and 3D Maps . . . • Recommended Charts • Easy to manipulate
Demo Conditional Formatting Pivot Tables Charts
Excel Services or Excel Online • Display Excel workbook in SharePoint • Worksheets, tables, charts can be displayed • SharePoint 2010 – 2019 Need Enterprise Version • SharePoint Online uses Excel Online • Configure during Save/Save As > Browser View Options
Displaying SharePoint Page • Different experience for classic vs. modern pages • SharePoint Classic - Excel Web App • Modern Page – File Viewer
Demo Excel Browser Options Embedding on SharePoint Page
Thank you! Donald Donais Twitter: @dondonais Email: ddonais@spdrummer.net