Download
1 / 19
190 likes | 361 Views
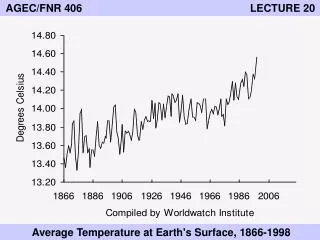
AGEC/FNR 406 LECTURE 20. Average Temperature at Earth's Surface, 1866-1998. Data/Graphics from the Midwest Climate Data Center http://mcc.sws.uiuc.edu/climate_midwest/mwclimate_change.htm#. Pollution Problem.

E N D
AGEC/FNR 406 LECTURE 20 Average Temperature at Earth's Surface, 1866-1998
Data/Graphics from the Midwest Climate Data Center http://mcc.sws.uiuc.edu/climate_midwest/mwclimate_change.htm#
Pollution Problem • Greenhouse gases are stock pollutants: environment has little or no assimilative capacity. • Dynamic problem: Persistence of greenhouse gases and continued use will add will likely increase global warming. • Potentially significant impacts on social, economic and ecological systems. • Even with remediation, effects will continue over an extensive time period.
Global Warming Truth or fiction? Intergovernmental Panel on Climate Change(international group of scientists)... “Warming of the climate system is unequivocal” Global warming of 3-8 degrees Celsius over the next 50 years
Evidence: 1. More warm days steady rise since 1982 1995-2006 rank as warmest since 1850 2. Melting of snow and ice 3. Record number of icebergs 4. Sea level rise (high confidence) 5. Changes in Gulf Stream 6. Changes in precipitation patterns 7. Coral reef damage from algae
IPCC 4 • 4th assessment report @ http://www.ipcc.ch “Eleven of the last twelve years (1995-2006) rank among the twelve warmest years in the instrumental record of global surface temperature (since 1850)”
What are the Greenhouse Gases? • Carbon dioxide (CO2) – 50% • Methane (CH4) – 18% • Nitrous oxide (N2O) – 6% • Hydrofluorocarbons (HFCs) • Perfluorocarbons (PFCs) • Sulphur Hexafluoride (SF6)
Carbon Dioxide • Nature: Cycled through various atmospheric, oceanic, biotic and mineral reserves. • Anthropogenic activities • Burning of fossil fuels (oil, natural gas and coal) for power generation and transportation. • Industrial processes. • Forest clearing. • Natural gas flaring. • Biomass burning.
Methane • Nature: Produced through anaerobic decomposition of organic matter in biological systems. • Anthropogenic activities: • Municipal solid waste landfills. • Wetland rice cultivation. • Livestock digestion. • Waste production. • Production and distribution of fossil fuels. • 20 times more effective at trapping heat than carbon dioxide.
Nitrous Oxide • Nature: Microbial processes of nitrification and denitrification in biological systems. • Anthropogenic activities: • Addition of nitrogen to soils – agriculture. • Industrial production activities. • Solid waste combustion. • Fossil fuel combustion. • 300 times more effective at trapping heat than carbon dioxide.
HFCs, PFCs, & Sulphur Hexafluoride • Anthropogenic activities: • HFCs are replacements for ozone-depleting substances. • PFCs and Sulphur Hexafluoride emitted in industrial processes: • Aluminum smelting. • Electric power transmission and distribution • Magnesium processing • Semiconductor manufacturing • Very long atmospheric lifetimes. Concentrations can irreversibly accumulate in the atmosphere.
Why Focus on CO2? Source: IPCC 4th Assessment Reporthttp://www.ipcc.ch/pdf/assessment-report/ar4/syr/ar4_syr_spm.pdf
Sources of CO2 Main source is fossil fuels (burning of coal coincided with the industrial revolution) Supply of CO2 in the U.S.1/3 Electricity and industry 1/3 Transport (cars) 1/3 Other (biomass burning, etc.)
Potential effects on: 1. Agriculture & forestry 2. Human health (disease transmission) 3. Fish, wildlife, and ecosystems 4. Coastal environments + water supplies Human-managed systems may adapt more readily than natural (non-managed) systems. Currently stressed systems may be at special risk.
Consequences for Ag 1. Higher temperature will shift agricultural production2. Variation in temperature US + 8% in winter + 3% in summer 2. Moisture reduced from East to West 3. More rainfall variability 4. Increased pest populations
Consequences for Fish+Wildlife • Changes in temp and precip. could cut breeding populations of ducks in half. • Cold water fish habitat could be reduced or lost in many states • Migration/breeding cycles may be disrupted for species that depend on temp signals (studies show some species of birds and amphibians are migrating and breeding earlier than expected).
Two ways to get rid of CO2 1. Reduce emissions (reduce energy use)2. Lock-up carbon somehow (in forests?) What is the cheapest way to do this from an economic perspective? 1. Moral suasion (unlikely) 2. Carbon taxes (unpopular) 3. Tradable permits (shows promise)
Benefits and costs 1. Aggregate damage estimates range from 1-1.5% of GDP (industrialized countries) to 2-9% of GDP (developing countries)2. Estimates of annual costs of stabilizing CO2 emissions at 1990 levels range from –0.5% to +2% of GDP.Is Benefit-Cost analysis the right tool?
Precautionary motive Future impacts are uncertain… Magnitude of problem is unknown… Catastrophic and irreversible effects are possible… Is there a need for precautionary action now?