Quantitative and Qualitative Data Analysis Lecture 1: Introduction
460 likes | 1.07k Views
Quantitative and Qualitative Data Analysis Lecture 1: Introduction. Statistics (3rd Ed.) by David Freedman, Robert Pisani and Roger Purves . Norton Doing Data Analysis with SPSS Version 12 by Carver and Nesh .

Quantitative and Qualitative Data Analysis Lecture 1: Introduction
E N D
Presentation Transcript
Quantitative and Qualitative Data AnalysisLecture 1: Introduction
University Of Malakand | Department of Computer Science | UoMIPS| Dr. Engr. Sami ur Rahman | 2 Statistics (3rd Ed.) by David Freedman, Robert Pisani and Roger Purves. Norton Doing Data Analysis with SPSS Version 12 by Carver and Nesh. Qualitative Data Analysis: An Expanded Sourcebook, by Matthew B. Miles and A. Michael Huberman. 2nd Edition. Sage Publications: Thousand Oaks, CA A Practical Guide to Scientific Data Analysis by David Livingstone ChemQuest, Sandown, Isle of Wight, UK Reference books
University Of Malakand | Department of Computer Science | UoMIPS| Dr. Engr. Sami ur Rahman | 3 Motivation What is Data? What is Data Analysis Quantitative Data and Qualitative Data Quantitative and Qualitative Data Analysis Outline
University Of Malakand | Department of Computer Science | UoMIPS| Dr. Engr. Sami ur Rahman | 4 Things aren’t always what we think! Blind men and an elephant
University Of Malakand | Department of Computer Science | UoMIPS| Dr. Engr. Sami ur Rahman | 5 Data Data: Values of qualitative or quantitative variables. What information do we get from this data??
University Of Malakand | Department of Computer Science | UoMIPS| Dr. Engr. Sami ur Rahman | 6 Data Analysis Sorted data
University Of Malakand | Department of Computer Science | UoMIPS| Dr. Engr. Sami ur Rahman | 7 Data Presentation Marks Hours studied
University Of Malakand | Department of Computer Science | UoMIPS| Dr. Engr. Sami ur Rahman | 8 Data analysis is the process of turning data into information An attempt by the researcher to summarize collected data Data Interpretation is an attempt to find meaning Good analysis communicates something meaningful about the world What is data analysis?
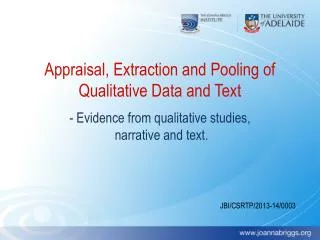
University Of Malakand | Department of Computer Science | UoMIPS| Dr. Engr. Sami ur Rahman | 9 Types of Data Quantitative Data: Data that is numerical, counted, or compared on a scale Qualitative Data: Textual data Interview transcripts Case notes/ clinical notes Photographs Video recordings
University Of Malakand | Department of Computer Science | UoMIPS| Dr. Engr. Sami ur Rahman | 10 Types of Data Analysis Quantitative Data Analysis: Converting quantitative data into information Qualitative Data Analysis: Converting qualitative data into information
University Of Malakand | Department of Computer Science | UoMIPS| Dr. Engr. Sami ur Rahman | 11 Quantitative Analysis
University Of Malakand | Department of Computer Science | UoMIPS| Dr. Engr. Sami ur Rahman | 12 Quantification Analysis : The numerical representation and manipulation of observations for the purpose of describing and explaining the phenomena that those observations reflect. Quantification of Data
University Of Malakand | Department of Computer Science | UoMIPS| Dr. Engr. Sami ur Rahman | 13 Quantitative Analysis Can be used to answer questions like • What is the percent distribution? • How much variability is there in the data? • Are the results statistically significant?
University Of Malakand | Department of Computer Science | UoMIPS| Dr. Engr. Sami ur Rahman | 14 Simple Quantitative Analysis • Averages • Mean: add up values and divide by number of data points • Median: middle value of data when ranked • Mode: figure that appears most often in the data • Percentages
University Of Malakand | Department of Computer Science | UoMIPS| Dr. Engr. Sami ur Rahman | 15 Central Tendency Central tendency: The way in which quantitative data tend to cluster around some value. A measure of central tendency is any of a number of ways of specifying this "central value" Central Tendency Average (Mean) Median Mode
University Of Malakand | Department of Computer Science | UoMIPS| Dr. Engr. Sami ur Rahman | 16 Mean • Mean (arithmetic mean) of data values
University Of Malakand | Department of Computer Science | UoMIPS| Dr. Engr. Sami ur Rahman | 17 Mean • The most common measure of central tendency • Affected by extreme values (outliers) 0 1 2 3 4 5 6 7 8 9 10 0 1 2 3 4 5 6 7 8 9 10 12 14 Mean = 5 Mean = 6
University Of Malakand | Department of Computer Science | UoMIPS| Dr. Engr. Sami ur Rahman | 18 Median Median: The “middle” number Not affected by extreme values 0 1 2 3 4 5 6 7 8 9 10 0 1 2 3 4 5 6 7 8 9 10 12 14 Median = 5 Median = 5
University Of Malakand | Department of Computer Science | UoMIPS| Dr. Engr. Sami ur Rahman | 19 Mode Mode: Value that occurs most often • Not affected by extreme values • There may be no mode • There may be several modes 0 1 2 3 4 5 6 7 8 9 10 11 12 13 14 0 1 2 3 4 5 6 No Mode Mode = 9
University Of Malakand | Department of Computer Science | UoMIPS| Dr. Engr. Sami ur Rahman | 20 Simple quantitative analysis • Graphical representations give overview of data
University Of Malakand | Department of Computer Science | UoMIPS| Dr. Engr. Sami ur Rahman | 21 Simple quantitative analysis • Graphical representations give overview of data
University Of Malakand | Department of Computer Science | UoMIPS| Dr. Engr. Sami ur Rahman | 22 Strengths of Quantitative Research • Precise, quantitative, numerical data • Testing hypothesis/confirming theories • Generalizing finding, random samples with sufficient size • Comparatively quick data collection • Less time consuming analysis • May minimize personal bias .
University Of Malakand | Department of Computer Science | UoMIPS| Dr. Engr. Sami ur Rahman | 23 Weaknesses of QuantitativeResearch • Only applicable for measurable (quantifiable) phenomena • Simplifies and ”compresses” the complex reality, lack of detailed narrative • Theories or categories might not reflect local constituencies’ understandings
University Of Malakand | Department of Computer Science | UoMIPS| Dr. Engr. Sami ur Rahman | 24 Qualitative Analysis
University Of Malakand | Department of Computer Science | UoMIPS| Dr. Engr. Sami ur Rahman | 25 Qualitative Data • Narratives, logs, experience • Interviews • Diaries and journals • Notes from observations • Photographs • Video recordings
University Of Malakand | Department of Computer Science | UoMIPS| Dr. Engr. Sami ur Rahman | 26 What is Qualitative Research? • Research studies that investigate the quality of • Relationships • Activities • Situations • Materials
University Of Malakand | Department of Computer Science | UoMIPS| Dr. Engr. Sami ur Rahman | 27 Qualitative Data Analysis Used for any non-numerical data collected as part of the evaluation • Unstructured observations • Analysis of written documents • Diaries, observations
University Of Malakand | Department of Computer Science | UoMIPS| Dr. Engr. Sami ur Rahman | 28 Qualitative Data Analysis Answers questions like: • Is the project being implemented according to plan? • What are some of the difficulties faced by staff? • Why did some participants drop out early? • What is the experience like for participants?
University Of Malakand | Department of Computer Science | UoMIPS| Dr. Engr. Sami ur Rahman | 29 Steps in Qualitative Research The steps are as follows (in some cases): • Identification of the phenomenon and hypothesis generation • Identification of the participants in the study • Data collection (continual observance) • Data analysis • Interpretation/Conclusions
University Of Malakand | Department of Computer Science | UoMIPS| Dr. Engr. Sami ur Rahman | 30 Generalization in Qualitative Research • A generalization is usually thought of as a statement or claim that applies to more than one individual, group, or situation. • The value of a generalization is that it allows us to have expectations about the future. • A limitation of Qualitative Research is that there is seldom justification for generalizing the findings of a particular study.
University Of Malakand | Department of Computer Science | UoMIPS| Dr. Engr. Sami ur Rahman | 31 Trustworthiness in Qualitative Research Check on the trustworthiness of the researchers: Compare one informant’s description with another informant’s description of the same thing. • Triangulation: Comparing different information on the same topic. • Data triangulation • Use of multiple data sources • Students, teachers, administrators, etc. • Methods triangulation • Interviews, observations, etc. • Researcher triangulation • Use a team of researchers.
University Of Malakand | Department of Computer Science | UoMIPS| Dr. Engr. Sami ur Rahman | 32 Criteria for judging research Quantitative • Internal validity • Did A cause B? • External Validity • Are these findings generalizable? • Reliability • Are the measures repeatable? • Objectivity • Are the findings free of researcher bias/values? Qualitative • Credibility • Believable from participant’s view • Transferability • Can this finding be transferred to other contexts? • Dependability • Would another researcher come to similar conclusions?
University Of Malakand | Department of Computer Science | UoMIPS| Dr. Engr. Sami ur Rahman | 33 Thanks for your attention