Download
1 / 28
290 likes | 483 Views
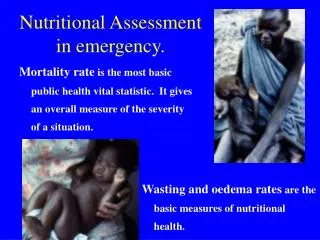
Mortality rate is the most basic public health vital statistic. It gives an overall measure of the severity of a situation. Wasting and oedema rates are the basic measures of nutritional health. Nutritional Assessment in emergency. Wasting rates Oedema rates CMR Also Essential

E N D
Mortality rate is the most basic public health vital statistic. It gives an overall measure of the severity of a situation. Wasting and oedema rates are the basic measures of nutritional health. Nutritional Assessment in emergency.
Wasting rates Oedema rates CMR Also Essential Population size Demography Needs context Needs food security data to be interpreted Quantitative Information
What can wasting/oedema rates tell us? • Wasting - problem with: • Diet quality - growth nutrients deficient • (protein, potassium, magnesium, sodium, phosphorus, zinc) • Total food availability (But low quantity also means lack of diversity and low diet quality as well) • disease (relatively small effect) • Oedema - problem with: • Diet quality - functional nutrients (antioxidants)
Surveys and surveillance • Surveys give prevalence of wasting: surveillance is related to incidence (x ascertainment) but cases are missed • Prevalence of community wasting and oedema rates measured by surveys: changes and trends measured by surveillance • Recent past mortality rates measured by survey: current rates measured by surveillance • Surveys are used to extrapolate surveillance data to the magnitude of the problem in the whole community
Anthropometric surveys give prevalence: incidence is needed to plan curative services50 red cases of Kwashiorkor and 20 cases of wasting
What area to survey • Each agency has different purpose for survey. National to micro scale. • To large a scale averages out pockets - • Washington would give an average of Chevey Chase and Anacostia - National surveys not very informative or sensitive to change. • To small a scale misses pockets and is not generalisable - only Chevey Chase would miss Anacostia and visa versa. It is difficult to use data to inform where there is a problem. • Areas/Sample based upon a common characteristic - Agroeconomic zones, tribal/ethnic areas, IDP/resident
When to do a survey? • Baseline data - before there are surveillance data. • Problem with: • Food security indicators • Economic, weather, harvest predictions • Political turmoil • Health centre/ hospital data • Seasonality • ??? Donor funding cycle ???
Other Nutritional causes of a rise in mortality rate • CMR high with relatively low wasting rate. • Functional nutrient deficiency is not associated with wasting. • Failure of wasting rate to predict problem but increase in CMR, and clinical illness. with pellagra outbreak.
Patients with Functional nutrient deficiency are not wasted - pellagra patients, even in an emergency situation are normal or fat!
Triangulation of mortality data • Retrospective survey • Surveillance data • Grave counting • Religious authority records • Demographic profile change • Mother: child ratio • Is it important to know who dies? • Is it important to know cause of death?
Triangulation of data Anthropometry & oedema prevalence Program coverage Mortality data Surveillance Incidence/coverage Population size and structure Other data needed to interpret discrepancies Other data needed to understand causes
Spread of survey does not change as the population becomes more malnourished
SD does not change as the population becomes more malnourished • All individuals in the population are affected by the situation to a similar extent • The whole distribution moves downwards • The weight loss of the heavy and light children in the population is the same • Movement in the WFH is not necessarily a “trailing indicator” in population terms.
The population remains normally distributed as wasting increases • Normal probability plots of weight-for-height z-scores of individual subjects from illustrative surveys. • The skewness of the reference population may be because of inclusion of obese individuals in the NCHS population.
Whole distribution moves down together • Clusters that are sampled are different from one another, but are relatively homogeneous within themselves. • Vulnerability seems to be geographically determined (Chevy Chase is different from Anacostia) - geographical targeting would be much cheaper and more efficient than identifying and targeting individual households
Whole distribution moves down together - 2 • We can accurately predict the prevalence of malnutrition from the mean value of the population. Much smaller numbers are needed for a survey. • This would allow spacial distribution of wasting to be assessed • This would allow much more frequent surveys to be done with the same funds
The actual Observed and theoretical prevalence of malnutrition are related within the confidence intervals of the survey – maybe calculation would be more precise?
Conclusions • Surveys give an good measure of the severity of a crisis • They require careful planning, experienced supervisors, good training and quality assurance • surveys and surveillance data should be used to inform when it is appropriate to open and close relief programs. This should be in relation to the local capacity to deal with ill or malnourished children.
Conclusions 2 • Who becomes malnourished may relate more closely to location than other vulnerability indicators • unreliable to judge the numbers of beneficiaries who will require relief (incidence-vs-prevalence) • should be combined with surveillance data • should be put into context with food security and other data