Download
1 / 23
230 likes | 398 Views
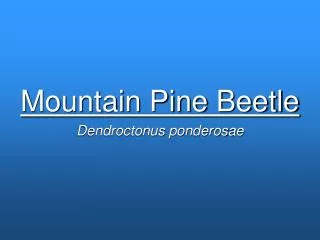
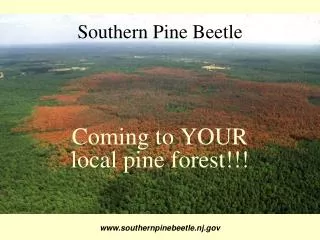
Linkages between Southern Pine Beetle Outbreaks and Forest Density. Dahl Winters December 6, 2006. Introduction. Southern pine beetle ( Dendroctonus frontalis ) is the most destructive insect to pine trees.

E N D
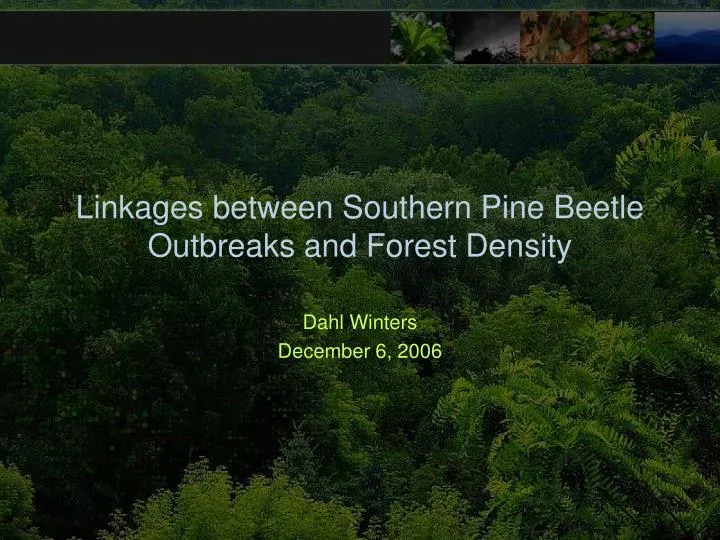
Linkages between Southern Pine Beetle Outbreaks and Forest Density Dahl Winters December 6, 2006
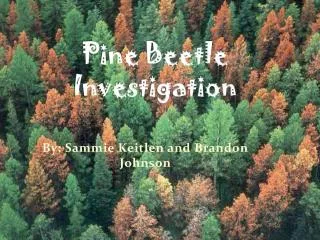
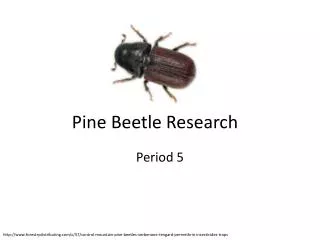
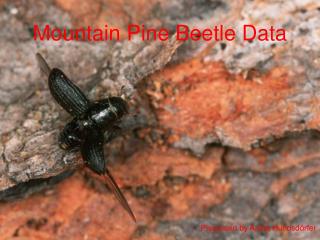
Introduction Southern pine beetle (Dendroctonus frontalis) is the most destructive insect to pine trees. Vast numbers of individuals can become infested and die, with large ecological and economic consequences. Images from http://www.na.fs.fed.us/spfo/pubs/fidls/so_pine_beetle/so_pine.htm and http://www.srs.fs.usda.gov/econ/data/spb/
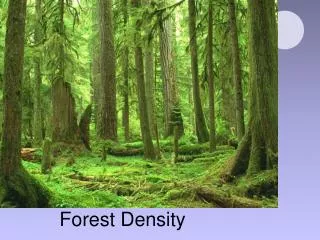
Questions • How might SPB infestations correlate withthe density of various forest types? • Questions that might be answered by answering the above: • Are SPB infestations more severe in pine plantations? • How might smaller, more mixed stands of pine-hardwood trees contribute to outbreak severity?
Data • 1. Land Cover Data: This data will be taken from the 2001 National Land Cover Dataset (NLCD 2001) – free download from the USGS Seamless Data Server. • SPB Infestation Data by County from 1960-2004 • Goal is to explore the environmental correlates (i.e. different quantities and patterns of forest cover) of SPB outbreaks. • Will focus attention on one region in one year • 1) identify and isolate SPB habitat and non-habitat from the NLCD 2001 raster dataset • 2) Identify and isolate SPB infestation data for all counties in NC and SC in 2001
Methods: Process Chart NLCD 2001 Land Cover Reclassified LULC data into 3 classes Extract by Mask to get LULC for just NC and SC Mosaic to join the two LULC rasters Select by Attributes to get just NC and SC data for 2001 1960-2004 SPB Infestation Data Wrote Python code to extract LULC rasters for each county Spatial Join to Infested Counties layer using FIPS code to get desired graphs later Copy pixel counts for the 3 classes into an Excel spreadsheet Normalization: use Editor to calculate values for pixel counts (one pixel = 30 sq m) Graph infestation severity vs. percent cover types Fit linear regressions to graphs to quantify trends Generate choropleth maps of each cover type to show distribution
NLCD 2001 Reclassification • 1. Definitely Habitat for SPB: • Evergreen Forest (42) • 2. Potential Habitat for SPB: • Developed, Low Intensity (22) – SPB often attack stressed and injured trees in older-aged dense stands – some neighborhoods might have these • Deciduous Forest (41) – might be small isolated populations of pine trees here that serve as stepping stones for SPB dispersal • Mixed Forest (43) – likely to have more pine stands than deciduous forest 3. Non-Habitat for SPB: Open Water (11) Developed, Open Space (21) Developed, Medium Intensity (23) Developed, High Intensity (24) Barren Land (Rock/Sand/Clay) (31) Shrub/Scrub (52) – since SPB attacks only mature trees, and the trees in this category would be young, early successional ones Grassland/Herbaceous (71) Pasture/Hay (81) Cultivated Crops (82) Woody Wetlands (90) Emergent Herbaceous Wetlands (95)
Python Geoprocessing Code • # --------------------------------------------------------------------------- • # Forest Extraction Script • # Dahl Winters • # --------------------------------------------------------------------------- • import sys, string, os, win32com.client • gp = win32com.client.Dispatch("esriGeoprocessing.GpDispatch.1") • # Check out Spatial Analyst extension license • gp.CheckOutExtension("spatial") • # Load required toolboxes • gp.AddToolbox("E:/Program Files/ArcGIS/ArcToolbox/Toolboxes/Analysis Tools.tbx") • gp.AddToolbox("E:/Program Files/ArcGIS/ArcToolbox/Toolboxes/Spatial Analyst Tools.tbx") • gp.AddToolbox("E:/Program Files/ArcGIS/ArcToolbox/Toolboxes/Data Management Tools.tbx") • print "toolboxes loaded..." • # Set workspace • gp.Workspace = "D:/GIS/cntyrasters" #where output files will be stored • print "workspace set..." • # Script arguments... • CountiesLayer = "H:\\GIS\\GIS593\\NCSCcounties-sel-join.shp" #The Infestation Counties feature layer or any other polygon layer • if CountiesLayer == '#': • CountiesLayer = "Infestation Counties" # provide a default value if unspecified • print "script args set..." • try: • # initializing variables • currentCnty = "Durham" • currentState = "NC" • cntyCount = 0 • LULCRaster = "H:\\GIS\\GIS593\\threeclass\\mosaic\\NCSClulc" #The input raster; contains the land cover data to be extracted by county • print "var init OK, now preparing to start raster extraction..." # Create search cursor to go through each county in the Infestation Counties file rows = gp.SearchCursor("D:/GIS/infested2.shp") #rows = gp.SearchCursor("H:/GIS/GIS593/NCSCcounties-sel-join.shp") row = rows.Next() while row: currentState = row.GetValue("ST") #gets the name of the state, since some counties are in NC and SC currentCnty = row.GetValue("CNTYNAME") #gets the name of the county print "now working on "+currentCnty, currentState+"...please wait..." if gp.Exists(currentCnty+currentState+".shp"): print "raster already exists; will skip..." else: # creates a properly formatted SQL statement for the Select Analysis procedure to follow strSQL = "\""+"CNTYNAME"+"\"" +" = "+ "'"+currentCnty+"'" +" AND "+ "\""+"ST"+"\"" +" = "+ "'"+currentState+"'" # selects the individual county from the larger CountiesLayer and saves it as a shapefile for further analysis gp.Select_analysis(CountiesLayer, currentCnty+currentState+".shp", strSQL) # using the individual county to extract and save the LULCRaster for that county # the parameter order is InRaster, InMask, OutRaster gp.ExtractByMask_sa(LULCRaster, currentCnty+currentState+".shp", currentCnty+currentState) gp.BuildPyramids(currentCnty+currentState) print currentCnty, currentState+ " complete." cntyCount = cntyCount + 1 row = rows.Next() except: # If an error occurred while running a tool, then print the messages. print gp.GetMessages() print "The number of counties processed was ", cntyCount del rows print "Done"
Choropleth Maps and Graphs • Calculated the following 4 percentages: • percent pine forest = pine pixels/total pixels * 100 • percent potential habitat = potential pixels/ total pixels * 100 • percent forested = pine+potential habitat/total pixels * 100 • percent non-habitat = non-habitat pixels/total pixels * 100 (just the inverse of percent forested) • Generated several choropleth maps using each of these percentages to visually estimate if there might be any correlations between infestation severity and the amount of different habitat types. • Used natural classification into 10 classes. Some of the percentages have interesting skews worth noting.
Histograms Percent Pine Forest Percent Potential Habitat Percent Forested Percent Non-Forest
Results - Amount of Forest Cover Yancey County was an outlier, likely due to miscalculation of infestation severity. The following graphs are adjusted to exclude this outlier. Interestingly, infestation severity declines if counties contain more pine forest area (not yet normalized to total county area).
Results - Amount of Forest Cover • Infestation severity increases in counties that have: • low pine habitat, • high SPB habitat, • high total forest area, and • fewer areas of non-habitat. • The second result is also interesting…
Results - Percent Forest Coverage • Now, the values on the X-axis have been normalized to represent (area of forest type / total forest area) * 100. • As the percent of pine forest increases, interestingly the infestation severity decreases. This is opposite of what was expected. • However, as the percent of smaller and more mixed pine-hardwood stands increases, infestation severity increases – 0.24 more infestations per 1000 acres for every % increase in potential habitat.
Results - Percent Forest Coverage • As the percent of both pine forest and smaller, mixed pine-hardwood forest increases, infestation severity increases more strongly from 0.24 to 0.26 infestations/1000 acres/% increase of forest area. • Another way to look at this: the more non-habitat, the lower the infestation severity, which is expected since there are fewer places for SPB to exist.
Conclusion • Prevention of SPB outbreaks should not focus on just pine plantations. • Smaller, more mixed stands of pine in both natural and residential areas are important to SPB outbreaks—there are more of them and are more widely spread • The connectivity of these smaller mixed stands is likely more important than we think it is, and merits further research into how it might affect SPB spread • Further research directions: use more of the 1960-2004 infestation data to see how land cover correlates with SPB outbreaks over time