Download
1 / 21
210 likes | 235 Views
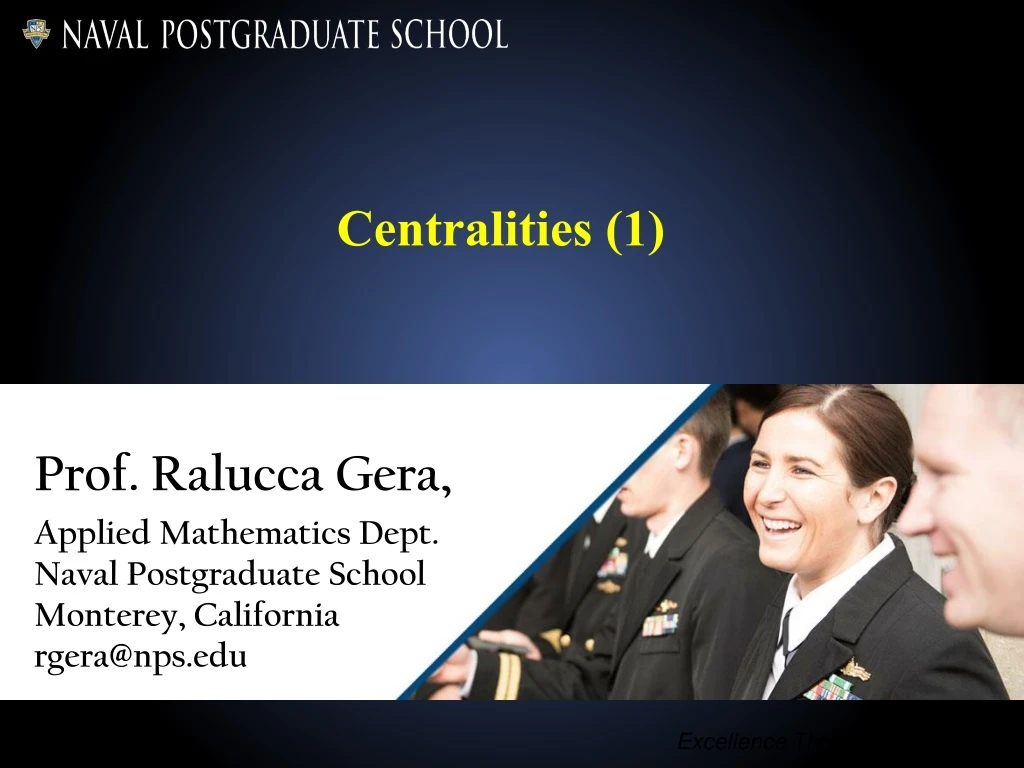
Centralities (1). Prof. Ralucca Gera, Applied Mathematics Dept. Naval Postgraduate School Monterey, California rgera@nps.edu. Excellence Through Knowledge. Quantifying network structure, identifying central nodes in networks. A survey of some of the widely used centrality measures

E N D
Centralities (1) Prof. Ralucca Gera, Applied Mathematics Dept.Naval Postgraduate SchoolMonterey, Californiargera@nps.edu Excellence Through Knowledge
Quantifying network structure, identifying central nodes in networks A survey of some of the widely used centrality measures in studying complex networks
In class exploration • Form 2 groups of 4-5 to explore centralities. • Each person will have a job in that group: • Manager: manages the group, makes sure the job gets done on time and all members participate and understand • Recorder: records the important aspects of the discussion, observations, insights • Presenter: presents oral reports to class for the group • Reflector(s): observes and comments (to the group) on the group dynamics to allow everyone to benefit from the exploration • I will monitor, facilitate and guide when questions are asked.
In class exploration • Objective: identify what makes a node central, and how could we capture it (before I present some standard measures and metrics). • This will enable you to • actively listen to the presentations on centralities • critically think and reason as the ideas on centralities are coming up in the next weeks • Extend the existing ideas/methods to create new centralities. • Use a similar process in the future
Which node is central? Source: Discovering Sets of Key Players in Social Networks – Daniel Ortiz-Arroyo – Springer 2010/
In class exploration • Fill in the table below with the ideas from the group discussions (20min) • Report to class (there is no right answer, several options)
Centrality and vertex notation • What is centrality? • It is a the quantification of the intuitive notion of importance of a node in a network. • Centrality is computed per vertex. • We tend to refer to vertices by their indices, such as and , rather than or , • so then the centrality is rather than , regardless of the property we maximize for nodes to be central.
Examples of central nodes • Friendship/Social Networks: • Mapping of richness, power, education level… or some other attribute of persons. • Public Transit Networks: • Central location, most developed location, popular for tourism … of the places • Communication Networks: • Role, cost, traffic based on location … of the devices • Co-authorship Network: • Popularity, h-index, Citations, Awards of people
A periodic table of centralities An interactive periodic table of centralities: http://schochastics.net/sna/periodic.html
Degree Centrality Excellence Through Knowledge
Degree Centrality Freeman, Linton C. "Centrality in social networks conceptual clarification." Social networks 1.3 (1978): 215-239.
Degree per vertex In Python: the sequence gives {vertex_label_1: degree_1, vertex_label_2: degree_2, …} {0: 4, 1: 7, 2: 2, 3: 4, 4: 2, 5: 1, 6: 1, 7: 1, 8: 3, 9: 1, 10: 1, 11: 3, 12: 1, 13: 1, 14: 1, 15: 1, 16: 1, 17: 1, 18: 1, 19: 1}
Degree per vertex as a vector 4 7 242111311311111111
Degree Centrality per vertex as a vector 4/20 7 /202/204/202/201/201/201/203/201/201/203/201/201/201/201/201/201/201/201/20 Or divide by not counting the vertex at which centrality is computed. Or divide by to normalize it since we only care for the relative centrality.
Computing degrees with NetworkX Code available in the dropboxfolder: DegreeDistributionOrHistogram.ipynb
Code • Matlab:http://tuvalu.santafe.edu/~aaronc/powerlaws/bins/ • Python: • (choice 1) https://chengjunwang.com/web_data_analysis/demo2_simulate_networks/ • (choice 2) https://arxiv.org/abs/1305.0215 and the package here:https://pypi.python.org/pypi/powerlaw • R:https://assemblingnetwork.wordpress.com/2013/06/10/network-basics-with-r-and-igraph-part-ii-of-iii/
Extension? • If degree centrality is used to measure the immediate influence in the network: • Information passing node to node (shows local influence in a network) • Virus propagation (shows the risk of infection) • In (directed) food web networks (predator power/pray risk) • How can this be extended to going beyond the nearest-neighbor (local neighborhood)? • Think about it, and we’ll talk about some of the common ones.
References • Freeman, Linton C. "Centrality in social networks conceptual clarification." Social networks 1.3 (1978): 215-239. • An interactive periodic table of centralities: http://schochastics.net/sna/periodic.html