Download
1 / 27
270 likes | 374 Views
This lecture explores the fundamentals of parametric tests, focusing on their assumptions, applications, and statistical significance. Key concepts such as the Two-Sample T-Test and Chi-Squared Tests are discussed, highlighting how these tools assess differences between sample means and variances. The lecture includes practical examples using sample data, statistical hypotheses, and the conditions under which these tests are appropriate. By the end of the session, participants will grasp the principles behind parametric testing and their importance in data analysis.

E N D
GG313 Lecture 8 9/15/05 Parametric Tests
Cruise Meeting 1:30 PM tomorrow, POST 703 Surf’s Up “Peak Oil and the Future of Civilization” 12:30 PM tomorrow POST 723(?)
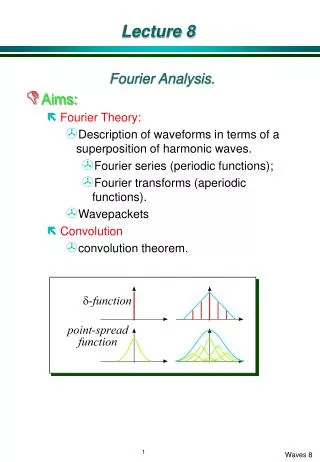
Parametric Tests What are parametric tests? Parametric tests make certain assumptions about the data. First, there is the assumption that the data are drawn from a normal distribution, second, the data are measured on an interval scale. Thirdly, parametric tests make use of parameters such as the mean and standard deviation. TWO-SAMPLE T-Test: For example, we have taken data in two samples and the samples have different means. What is the probability that the samples come from the same population? This is a job for the Student’s T-test again. We will assume that the populations have the same variance but possibly different means.
We want the probability distribution of x1-x2, the difference between the means of our samples. The distribution should be normal if the samples are independent and random, with a mean of µ1-µ2. The standard deviation will be: Our hypothesis is that the means are different, so our null hypothesis (Ho) is µ1=µ2. If n1 and n2 are large, then we can use z statistics:
Example: We get two random samples of magnetite from separate outcrops. The measured magnetizations (Am2/kg) are: We’ll arbitrarily used the common 95% confidence interval, so =0.05. The degrees of freedom are =5+6-2=9, and tinv(0.95,9)=2.262 gives the t-value. We reject Ho if the t=value for the data is greater than 2.262. Our data yield: x1=92.0, s1=5.0, and x2=99.9, s1=5.5.
Thus our samples look like they come from the distributions shown below: Could they come from the same population? By using the distribution of x1-x2 we can think of this as asking whether this distribution is statistically different from a distribution with µ=0.
Using eqn. 2.8, we get: Since t>2.262, we can reject H0, that the means are the same with 95% confidence, and can conclude that the magnetizations of the two outcrops are different. Try another one: We have age determinations from two different rocks dredged from an Emperor seamount. They are: Sample 1: 42.2, 43.2, 41.9, 43.0 MY And Sample 2: 39.9, 41.5, 41.0, 42.0 MY At 95% confidence, do these rocks have different ages?
Tests on the Standard deviation: We want to test our sample standard deviations, s, to see how well they likely reflect the population standard deviation ,. We may, for example, want to test whether the standard deviation of our sample is different from the variance of a known population. The statistic used is 2, pronounced Chi-squared.. Notice that the distribution is not symmetric, so the probabilities in our tails will need to be computed separately.
The value of 2 depends on the degrees of freedom, (pronounced: nu) = n-1, the standard deviation of our sample, s, and the standard deviation of our reference population, . Like the z-statistic for the normalized normal distribution and the t-statistic for small sample sizes are used to evaluate means, the 2 statistic is used to evaluate standard deviations for small sample sizes. The 2 distribution shows how the standard deviation would vary over a large number of samples with n items. Since the terms are squared, it is always positive. Small values of 2 imply nearly identical values of xi, and large values imply a large spread in xi.
This plot was generated using Excel: =-(CHIDIST($A7+0.01,B$3)-CHIDIST($A7,B$3))*100 Where A$7 is the deg of freedom and B$3 is x.
We use the 2 statistic to get the confidence interval on the variance: Like the other statistics, if n is large, we can use z-statistics. The 2 statistic approaches the normal distribution, and the limits become:
One test we might need is to determine whether the standard deviation of our sample, s, is different from that of a given population, . The null hypothesis is that they are the same, s= . EXAMPLE: We have 15 values of temperature with s=1.3°C. Previous results have given us =1.5°C. Are these results statistically different? The H0 hypothesis is s= , and plugging =0.05, =14 into our 2 table yielding 20.025=26.119 and 20.975=5.63. We to be sure 2 is not greater than either side. From our data: Since 10.5 is not greater than 26.119 and 5.63, we cannot reject the idea that the standard deviations are the same.
Again, for large sample sizes the 2 probability approaches a normal distribution, so we can use z statistics: Test: Are two standard deviations different? When using the t-test to see whether two sample means were the same, we assumed that the variances of the samples were the same. This may not be the case, and we can test to see if they are. An appropriate statistic is the F-statistic:
The F-statistic is the ratio of the variances of the two samples. For normal distributions, it is continuous, with a probability distribution called the F-distribution. There are two degrees of freedom, one for each sample, 1=n1-1, and 2=n2-1.
F Distributions 50,50 1,1 10,10 50,1 This plot was generated with Matlab fpdf. The F-distribution is strongly dependent on the degrees of freedom of the two samples, 1 and 2.
Example: In a previous example concerning magnetization, (n1=6 and n2=5, s1=5.0 and s2=5.5 ) we assumed that the ’s for the two populations were the same. Is that true? We calculate the F statistic for the data using Eqn. 2.19: And find the F value for a confidence interval of 95% using the Matlab finv function, finv(0.975,5,4)=9.36. Since 9.36 is larger than 1.21, the standard deviations are not significantly different at the 95% confidence interval. How large would s2 need to be to say that they WERE different? In this example, s2 would need to be greater than 15!
The 2 Test The 2 Test is used to determine if a particular probability distribution matches one of the theoretical distributions. This is the last parametric test we will look at. The 2 Test usually uses “binned” data that are normalized, squared, and summed: If we take all possible samples with n members from a normal population and plot the above, we get a 2 distribution. If our data are binned into k bins, we can compare the number of elements in the jth bin with the expected number of elements in the known distribution:
Where Oj and Ej are the observed and expected numbers in the jth bin. This is non-dimensional, since we are using “counts” as the units. From earlier, the probability that m out of n counts will fall in the jth bin is given by the binomial distribution: How we bin the distribution to find pj depends on what distribution we want to compare our data to.
Plugging into the equations above, This equation gives us a 2 value for our data to compare with a value for our confidence interval. EXAMPLE: We have 48 values of salinity from Whitewater Bay, Florida. Do these observations come from a normal distribution? The answer could have implications for models of mixing salt and fresh water. Get the mean and standard deviation of the data (Table 2.2). µ=49.59 and s=9.27. Normalize the data: zi=(xi-49.54)/9.27
3) Choose bins: we want each bin to contain some data, and we choose 5 bins with boundaries set such that the expected value in each bin is the same: 1/n=0.2. The expected value in each bin will then be the same for all bins: Ej=48/5=9.6. 4) Find the bin boundaries in the distribution curve that divide the curve into 5 bins with equal probabilities. For this problem using the normal curve, the boundaries are -0.84, -.26, .26, and 0.84.
5) Place the data into the proper bins: (see figure above) 6) Get the 2 value for the data. Using eqn. 2.21, we get: 7) Get the theoretical 2 value .We have 5 bins and used one degree of freedom to compute s, thus we have 5-2=3 degrees of freedom. For a 95% probability, and 3 degrees of freedom, we get 2 =5.99. 8) Compare: Since the H0 value of 2 is less than the theoretical value, we cannot reject the null hypothesis that the data have a normal distribution with 95% confidence.
As part of homework: Stand 8’ from a vertical wall and toss coins such that they hit the wall. Measure how far from the wall the coin lands. If the coin doesn’t hit the wall before the floor, ignore the result and toss again. Do this again at 12’ from the wall. Plot your data. Easy cumulative: y axis = number of events where the distance measured is <x.
Testing Correlation Coefficients In nearly all situations we find that two data sets are correlated to some extent; it is rare to find two samples that have a correlation of zero. But what correlation is SIGNIFICANT? Rceall the correlation coefficient between two samples, x and y (eqn.1.107) Eqn. 2.28 Where is the correlation of the population that we estimate from samples yielding r, the sample correlation coefficient. We ant to test the significance of r.
For a null hypothesis, we choose that the population correlation coefficient is zero, =0. If this were the case, then the distribution of r would have a mean of zero, µ=0, and a standard deviation of We use the t-statistic: Eqn. 2.29
Example: Toss two dice one red, one green and get the following numbers in 6 trials: Using 2.28, we get r=0.66. That seems high for a measurement where we expect no correlation. Is it significant? We choose =0.05 and find t/2=3.182. Applying 2.29 gives t=1.52, hence the observed 0.66 correlation is most likely random. The value of r would have to be much higher to get 95% confidence that the results were correlated:
Consider the figure below from a proposal. It shows the correlation coefficient between small volcanic earthquakes correlated against a reference quake late on day 8. It’s obvious that the high correlations are significant, but are the low ones?
For a plot like this, it would be good to include horizontal lines to show significance. I don’t know the value of n (the length of each earthquake record), so I can’t add it, but it might look like this: Implying that nearly all the correlations shown are significant.