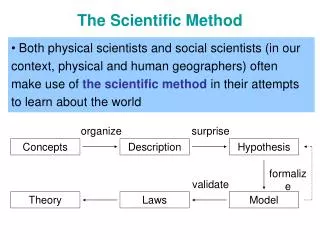
The Scientific Method
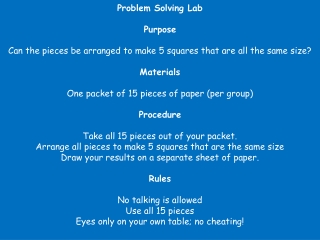
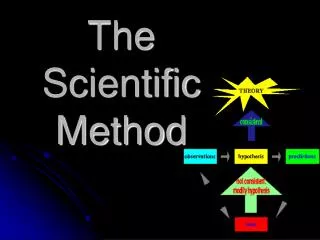
The Scientific Method. 1. S tate the Problem 2. G ather Information 3. F orm a Hypothesis 4. T est the Hypothesis (experiment) 5. R ecord and Analyze Data 6. S tate the Conclusion 7. R epeat the Work (" S tanley G athered F ew T rophies R acing S low R abbits.").

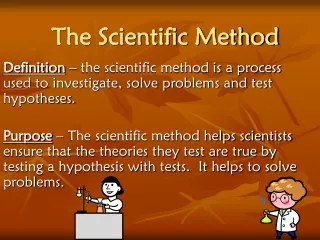
The Scientific Method
E N D
Presentation Transcript
1. State the Problem • 2. Gather Information • 3. Form a Hypothesis • 4. Test the Hypothesis (experiment) • 5. Record and Analyze Data • 6. State the Conclusion • 7. Repeat the Work • ("Stanley Gathered Few Trophies Racing Slow Rabbits.")
~ Recording Data ~ Ways to record the content of M&M's or Skittles candy bags: Skittles Lab - Data Tables, Graphs and Charts
Frequency of Days per School Year that K- 6th Grade Students play Board Games. Histogram (Bar Graph): • Histogram (Bar Graph) Analysis: • 3rd graders play Board Games more often in third grade than other grades.
Percentage of AAEStudents Who Like the Taste of SPINACH: Survey Question: Do you like Spinach? Pie Chart Analysis: 10% of AAE students like SPINACH. 90% do not like SPINACH.
The Line Graph: Data Analysis: What happened to the temperatures in New York City? Temperatures increased from Day 1 to Day 6
Data Analysis: On which day of the week are the least potatoes consumed? The lowest number of kilos of potatoes are consumes on Thursdays
Data Analysis: What happened to the value of Sarah's car from 2001 until 2007?
Click here: Chewing Gum Facts / More Gum Fun Facts
Does chewing gum gain mass, lose mass, or does the mass stay the same after chewing?
Find out what chewing gum is made of, when it was first invented, who invented it, how bubble gum is made, learn about the chemistry of sugar……
If I chew gum for _______________ , then its mass will ____________
Do an experiment to test your research problem. • Develop a materials list. • Decide upon a procedure. • Choose equipment for measuring
Record the mass of the gum before and after chewing. What do the results show? Decide whether you will show the data in a table , chart or graph format.
What DOES happen to the mass of chewing gum as a result of chewing it? Why does the mass of gum change?
Was your hypothesis correct? Pop!" Gum Yum Yum Bubble Gum