Download
1 / 16
160 likes | 312 Views
R-82868401. Coastal development impacts on biological communities in the Chesapeake Bay Examples from the Atlantic Slope Consortium. Atlantic Slope Consortium (ASC) = An Estuarine Indicator Research Program. Cast of many…

E N D
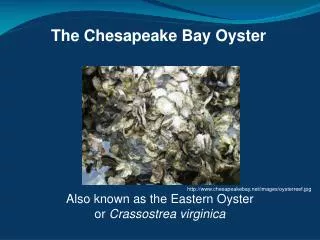
R-82868401 Coastal development impacts on biological communities in the Chesapeake Bay Examples from the Atlantic Slope Consortium
Atlantic Slope Consortium (ASC) = An Estuarine Indicator Research Program Cast of many… Smithsonian Environmental Research Center (SERC): Bill Deluca, Pete Marra, Don Weller, Tom Jordan, Tuck Hines, Chuck Gallegos, Ryan King, Matt Baker Virginia Institute of Marine Science (VIMS): Donna Marie Bilkovic, Carl Hershner, Molly Roggero Penn State University: Rob Brooks, Denice Wardrop Goal: To develop a suite of ecological and socioeconomic indicators for assessing and managing the condition of the vital resources in the Mid-Atlantic region
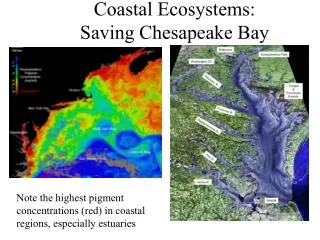
Coastal development leads to disruption of ecosystem services… Coastal development and deforestation reduce the filtration capacity of the riparian zone which impacts the littoral zone
Natural System Loss of ecosystem function and structure due to coastal development Wetland loss Forest loss Nutrient input Water clarity DO Terrestrial inputs Aquatic vegetation Biodiversity Functional groups Resilience Shoreline Littoral Biota Developed=Broken Links Broken Linkslead to decreases in biodiversity and functional groups that reduce resilience, andthe ability of the communities to respond to external drivers such as climatic events Shoreline Littoral Biota
Developed Agricultural Mixed-Developed Mixed-Agricultural Forested ASC Goal: to identify linkages between patterns of land use and environmental indicators in estuarine habitats. • “Estuarine segments”: Watersheds and subestuaries of a larger estuarine ecosystem • Segment land-use ranges from forested to highly agricultural or developed
Fish Communities and Habitat p=0.003; High vs. Minimal p<0.001; all different Higher FCI scores were associated with increasing abundance of subtidal habitat FCI scores were lower at sites with highly altered shorelines versus natural shorelines. Bilkovic et al. 2005
Invasive Species and Development 7 7 6 6 5 5 abundance estimate abundance estimate 4 4 3 3 2 2 2 r r r = 0.61, = 0.61, = 0.61, P P P < 0.001 < 0.001 < 0.001 2 2 Developed Developed Phragmites Phragmites Mixed Mixed - - Dev Dev 1 1 Agricultural Agricultural Mixed Mixed - - Ag Ag Forested Forested 0 0 0 0 20 20 40 40 60 60 80 80 % Developed Land in Watershed % Developed Land in Watershed Whigham et al. 2005
White Perch and PCBs Total PCBs in white perch in relation to percent developed land in the watershed. USEPA (1999) guidelines for cancer health endpoints. King et al. 2004
Juvenile Blue Crabs and Habitat Juvenile blue crabs (< 3 in) were most abundant at sites with extensive shoreline wetlands, forested watersheds, and sub-estuaries with average salinity > 16 ppt. King et al. 2005
Changepoint Analysis— Assessing Ecological Thresholds Cumulative Probability Curve Negative macrobenthic community responses occurred when developed shorelines were 10% or higher. Bilkovic et al. 2006
Stream Macroinvertebrates and Development Development appeared to have its greatest effect on stream macroinvertebrates when close to the sampling station, where it contributes to riparian degradation and reduced woody-debris input. 21-32% Dev. threshold Stream macroinvertebrate dissimilarity scores Cumulative Probability of A Threshold Increasingly positive scores=more diverse, pollution-sensitive taxa Increasingly Negativescore = taxa associated with impaired streams 1-22% Local Dev. threshold King et al. 2005
Marsh Bird Integrity and Development When 15% of the land within 500 m of a marsh was developed there was a significant decline in Marsh Bird Community Integrity. DeLuca et al. 2004
Ecological Thresholds of Communities 1 Invert IBI 0.8 Phrag abundance Water bird index 0.6 Wetland bird index Probability of Change 0.4 Benthic IBI 0.2 0 1 5 30 35 40 45 50 55 60 65 70 76 80 85 90 95 25 10 15 20 100 % Development Sources (SERC; VIMS): Dennis Whigham, Donna Marie Bilkovic,Ryan King, Bill Deluca, Peter Marra, Matt Baker, Don Weller, (Figure from Dennis Whigham) Threshold analyses: Qian et al. 2003 (Ecol. Mod.);King and Richardson2003 (Env. Man.)
Do Biota Respond to Variations in Nearshore Condition? YES--Our research indicated that structural and functional changes in biological communities occurred in relation to alterations in subtidal habitat, shoreline condition, and/or land use.
SUMMARY • Both the amount of development and its proximity to the estuary or wetland contributes to degradation of aquatic resources. • In general, > 20% development (at local and/or watershed levels) was related to shifts in biological communities (indicators), revealing possible ecological thresholds • Forest buffers were also noted to reduce sediment and nutrient loads along stream corridors or around wetlands • In many instances, local development had stronger links with the aquatic resource than watershed development FINAL ASC REPORT ONLINE: http://www.asc.psu.edu/public/pubs/_Final%20Report_AtlanticSlopeConsortium.pdf