Download
1 / 1
10 likes | 79 Views
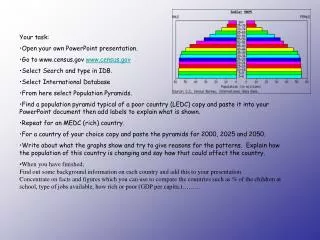
This presentation delves into population pyramids of countries to analyze demographic trends between LEDC and MEDC nations. By examining pyramids for specific years (2000, 2025, 2050), insights are drawn on population growth patterns and their implications. The presentation also entails background information on each country, focusing on relevant statistics for comparison such as GDP per capita, employment types, and educational indicators.

E N D
Your task: • Open your own PowerPoint presentation. • Go to www.census.gov www.census.gov • Select Search and type in IDB. • Select International Database • From here select Population Pyramids. • Find a population pyramid typical of a poor country (LEDC) copy and paste it into your PowerPoint document then add labels to explain what is shown. • Repeat for an MEDC (rich) country. • For a country of your choice copy and paste the pyramids for 2000, 2025 and 2050. • Write about what the graphs show and try to give reasons for the patterns. Explain how the population of this country is changing and say how that could affect the country. • When you have finished; • Find out some background information on each country and add this to your presentation. • Concentrate on facts and figures which you can use to compare the countries such as % of the children at school, type of jobs available, how rich or poor (GDP per capita.)………